What's New in Planning Analytics Workspace 2.0.57

Well, it has finally arrived! Planning Analytics Workspace 57 is here, and it is an exciting release.
Users will notice a number of functional and cosmetic updates in this release, however, this blog post will focus on the groundbreaking new product enhancements.
The main Planning Analytics Workspace 2.0.57 features and updates covered:
Changes to ‘Welcome’ and ‘Administration’ pages
‘Books and Visualizations’ improvements
The brand-new algorithm-based Forecasting feature
Applications and Plans workflow feature
Welcome and Administration Pages
The Welcome Page has some eye-catching cosmetic updates which include major layout changes as well. With the release of Applications and Plans in Planning Analytics Workspace 2.0.57, the Welcome page is fit with 4 tiles: Applications and Plans, Reports and Analysis, Data and Models, and Administration. Users can find their Shared and Personal books (seen further down on the Welcome Page in previous iterations of Workspace) within the ‘Reports and Analysis’ tile. The Applications and Plans tile is simply where users can go to create new Applications and Plans or find the ones that have already been created. By clicking on Data and Models, Workspace takes the user to a new model book page, allowing the user to create a book from scratch.

Users will notice that the Administration page has also been reorganized, allowing for a more streamlined admin experience. There are several tiles included on the admin page: Databases, allowing users to monitor the health of their databases, and Users and Groups gives users insight into the number of users assigned to each role. If Workspace is being run locally, there will be another tile for Agent. If Workspace is being run on cloud, the Secure Gateway tile is visible.

Books and Visualizations
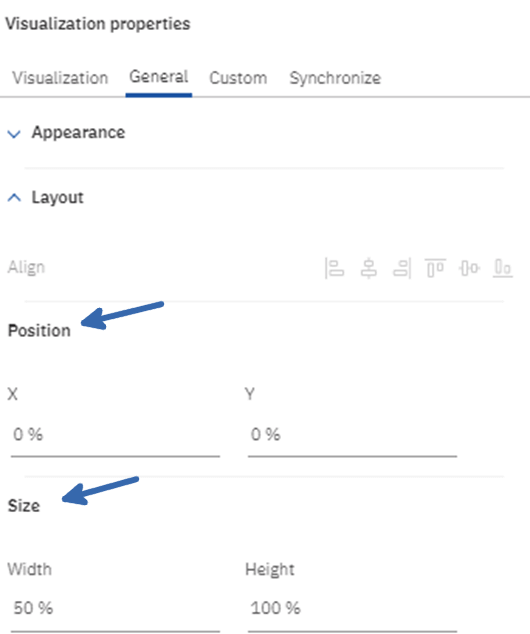
Within the Books and Visualization improvements, one update that many users have been waiting on for a long time is being able to precisely move images and objects within a sheet. This may seem like a simple and mundane improvement, but for those of us who have spent a lot of time building books and sheets within Workspace, this will be extremely useful. From a purely aesthetic point of view, this will prevent users from tearing out their hair in moments of pure frustration when an object doesn’t fit as intended or doesn’t go to the edge/bottom of the sheet as desired. Along with being able to precisely manage objects by dragging the mouse across the screen, there is an expanded selection of properties in the properties menu: Alignment, Positioning on X/Y axis, Size of object height/width, additional customized coloring options, and additional customizable visualization ability (font, coloring, etc.). Both the X/Y positioning and the object height/width can be manually configured on the sheet itself but can also be edited by typing in the desired value within the Properties menu, under the general tab shown below. This is just a sampling of the many improvements and features in the formatting section that Workspace users have been looking forward to for quite a while.
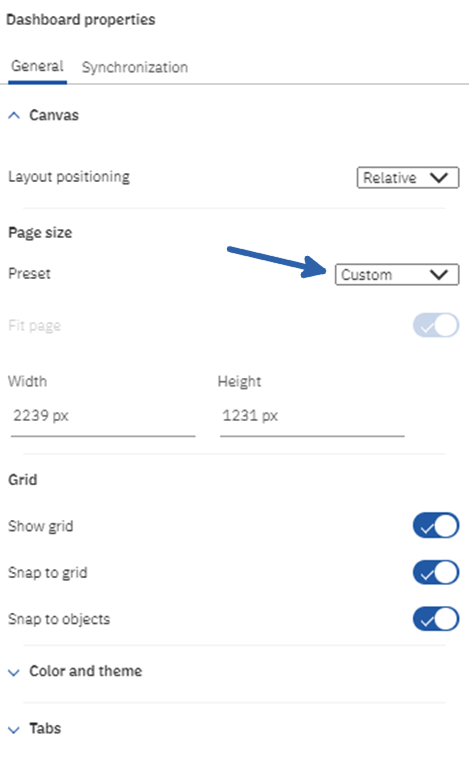
The other Books and Visualizations improvement we should briefly touch on is the Dashboard Properties. Within the Properties menu, when the dashboard itself is selected you have the option to size it to any of the size templates shown under the drop-down list under Page Size and Preset. This includes 16:9, 4:3, and Letter, to name a few. We’ve heard complaints before about how dashboards can become deformed when it is built on one size screen or resolution and viewed on another. With differing resolutions and sizes of screens, it becomes nearly impossible to format a book to fit them all. It’s nice to see IBM addressing the issue in this release. While it seems like a small issue to address, it will save developers and architects a ton of time trying to build a ‘one-size-fits-all’ dashboard.
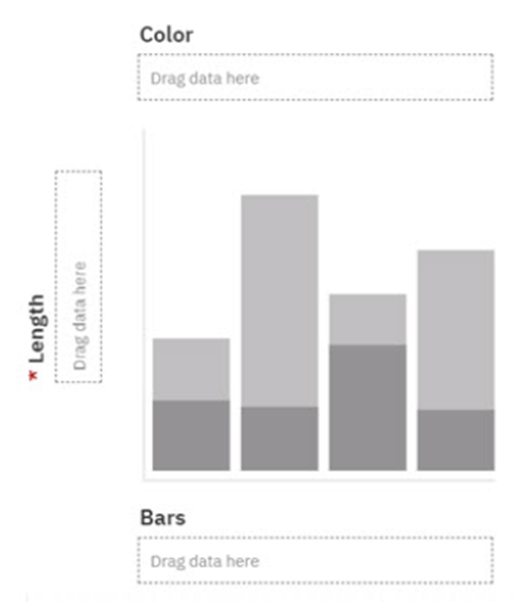
Another interesting feature within this update is the ability to place an empty visualization within the sheet and select dimensions to be included in the visualization after it has been added. In previous iterations of Workspace, users would have a cube view that they would have to slice and dice to make it fit the criteria of a desired visualization. Now users can put the cart before the horse and build a visualization dimension by dimension, right on the sheet itself. This may take some getting used to for some and users can still do it the old way if that is more comfortable, but this will be a very beneficial addition to the Workspace features.
Forecasting
Forecasting is a brand-new feature in Workspace and allows the modeling of trend, seasonality, and time-dependent data. Users are able to forecast in line, bar, or column visualizations. For more customization, it allows users to turn seasonality on or off, select a confidence interval, and ignore a historical outlier period if needed. For example, if the organization has a down month in sales due to a one-time event, that month can be excluded from the forecast to improve predicted accuracy of future sales.

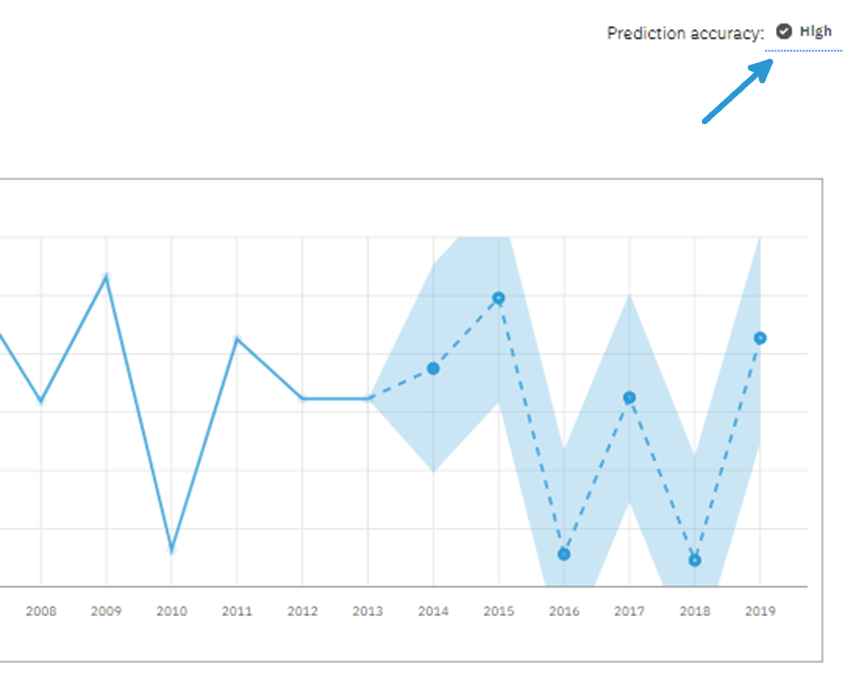
One tool within forecasting that we’ve found useful thus far is the ability to preview the predicted forecast before adding it to the dataset. Until users are comfortable using the forecasting tool in Workspace, or are just unfamiliar with forecasting in general, having the ability to preview a visualization of the forecast before committing the data is a really nice feature to have.
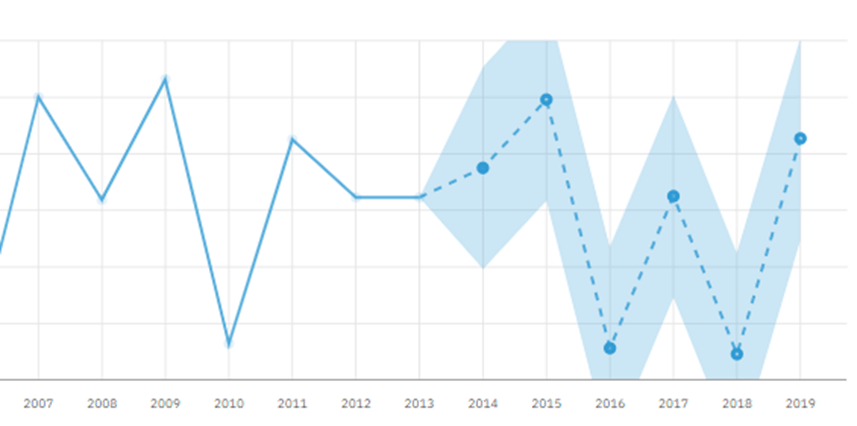
Besides being able to see the chart visually in the preview, having the prediction accuracy included in the top right corner also gives the user a sense of how weak or strong the prediction is based on the amount of data they provided to the forecasting tool.
Applications and Plans
Applications and Plans are also new to Workspace. Applications contain related books, views, and websheets, grouped into sections. Each section can be assigned to a user group to reflect the organizational structure. A Plan contains the same assets (books, views, and websheets) but is grouped into steps. This allows users to assign due dates for specific tasks within their planning process. A Plan also gives users the ability to require a submission for individual tasks, allowing them to accept the task as complete or reject if done incorrectly. Due dates and submissions are what make Plans more structured and organized than Applications, perfect for month-end close tasks. Both features will go a long way in helping users structure their business hierarchy within the Workspace environment, allowing them to streamline regular business processes.
Conclusion
While we’ve only scratched the surface on the Workspace 2.0.57 release, hopefully this overview provided insights into some of the wonderful updates and powerful new tools now available. We will continue to offer more info on Planning Analytics Workspace 2.0.57 in the form of YouTube Livestreams, Planning Analytics tutorials, and future blog posts so be sure to check out our YouTube channel and our Planning Analytics Blog Posts.
For the full list of changes included in this release visit the complete changelog from IBM here: What’s new in Planning Analytics Workspace.
Next Steps
We hope you found this article informative. Be sure to subscribe to our newsletter for data and analytics news, updates, and insights delivered directly to your inbox.
If you have any questions or would like PMsquare to provide guidance and support for your analytics solution, contact us today.
