The Value of Cognos Schematics

The Value of Schematics
Schematics are typically used to show components, parts, tasks, and their connections via a drawing consisting of standard symbols. Of course, in electrical engineering or mechanics, the value and practical application of schematics are obvious (though not always...see the entertaining schematic below from a 2014 edition of EDN, an electrical engineering magazine…Tear Collector?!?!...2 enter Arena and only one leaves?!?!...what are we looking at?).

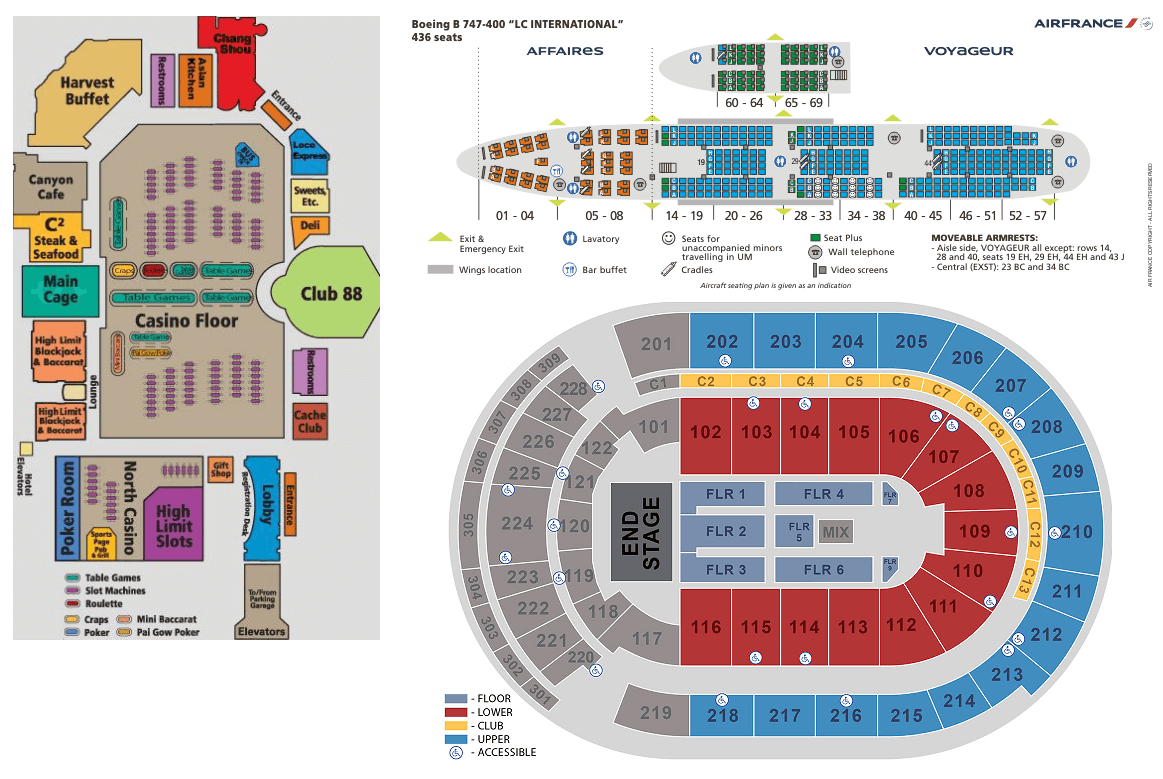
What I love about conventional schematics is how they so succinctly represent the very specific process, circuit, assembly, part, etc. at hand. No other graphic representation could do it better. There are plenty of business schematics that effectively do the same. Think of your particular business and how certain graphical representations of your business can succinctly represent your domain. Casino floor maps with walkways, traffic flows, slot machines, and gaming tables. Arena/airline seating charts with seats, seat numbers, aisles, exits, galleys, bathrooms. Grocery stores with aisles, product placement, ad locations, sale items. For certain applications, there’s no better way to visually represent your business than via a subject area aligned business schematic.
Custom Schematics in Cognos Analytics
Cognos 11.1.5 (& newer) allows developers to incorporate custom schematics via scaled vector graphics, which are based on xml. This means that you can modify the xml of the graphic to create reference objects that you can use to align your data with parts of the graphic. Let’s step through some of the work that has to be done to make custom schematics work. For the following exercise, I used a fictitious soccer organization that runs multiple fields, of multiple sizes, at multiple locations, during the COVID-19 pandemic. The pandemic introduced new, critical capacity limits for companies like this soccer organization, restaurants, retail stores, etc. The idea being that fewer number of people in a given space means less potential spread. These capacity limits were mandated by state and federal entities and differed by state/county/region. For businesses that chose to operate in this environment, it meant having to proactively manage density for their respective locations…something that these companies likely rarely had to consider previously. So, the goal for our exercise is to bring in a custom schematic that represents visually the facilities where this soccer organization operates and ensures that they aren’t overbooking fields in order to comply with safety mandates.
Creating Custom Schematics
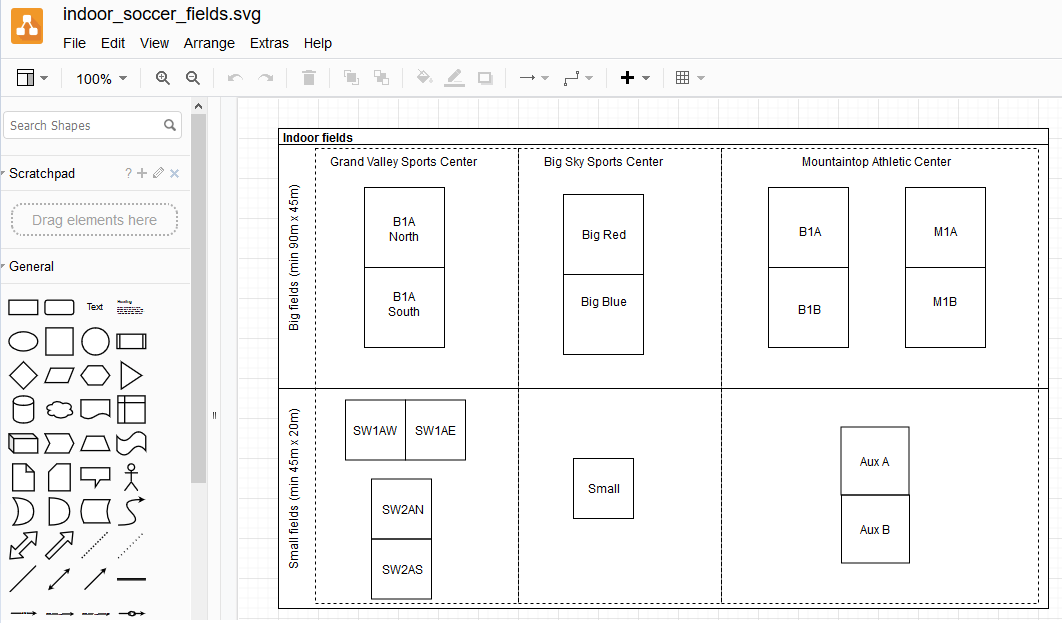
For custom schematics, Cognos Analytics requires the visualization to be in svg format. There are many tools that one can use to create svg’s. For quick (and free) graphic creation, I chose to use draw.io, as Google’s WYSIWYG diagram editor is easy to work with when creating something from scratch. You can import one or many svg’s into Cognos Analytics for one schematic package. If many, they all must share a common key strategy. For simplicity’s sake, I chose to create just one with locations (sports centers) that we can tie to views, to allow users to show/hide by location using standard Cognos Analytics visualization interactivity.
Modifying Custom Schematics
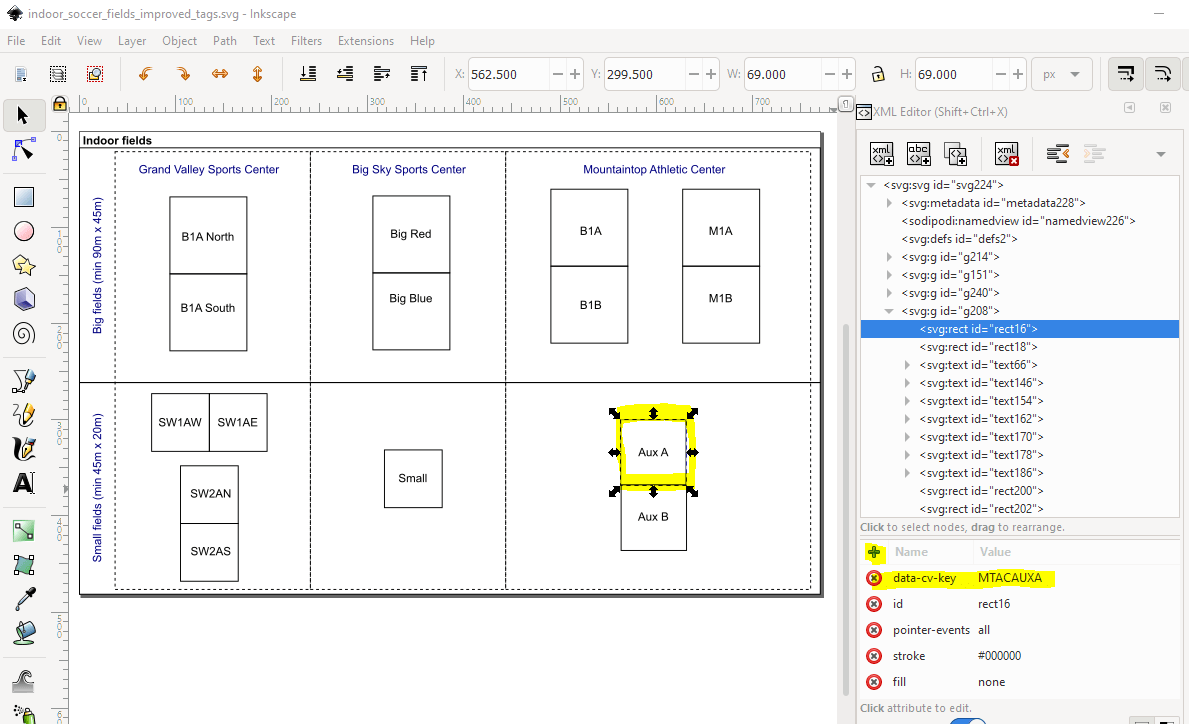
That was a good start to creating the graphic, but now we need to modify the xml in order to make it usable by the data in our Cognos Analytics environment. To modify the xml, I chose to use Inkscape. Inkscape is open-source, easy, and has a nice xml editor…which is exactly what we need. I could have also just created the svg directly from within Inkscape, though draw.io is a little easier to use for a novice graphic designer. I opened the svg in Inkscape, launched the XML Editor (Shift+ Ctrl + X), then went about modifying the xml. For places where I wanted a view, I created a new xml attribute named data-cv-view name and set a user-friendly title.

For places where I will want to assign a data value, I created a new xml attribute named data-cv-key and assigned it a key value that I’ll use to assign data to it.
Creating Schematic Packages in Cognos
At this point, we are finished with the svg and its xml. Now we need to pull it into Cognos Analytics. To do so, start by opening a new report using the data source that you had in mind. From the Toolbox, under the Developer section, drag a Test Schematic widget onto the canvas. Switch to Page Preview so that you can create the package.
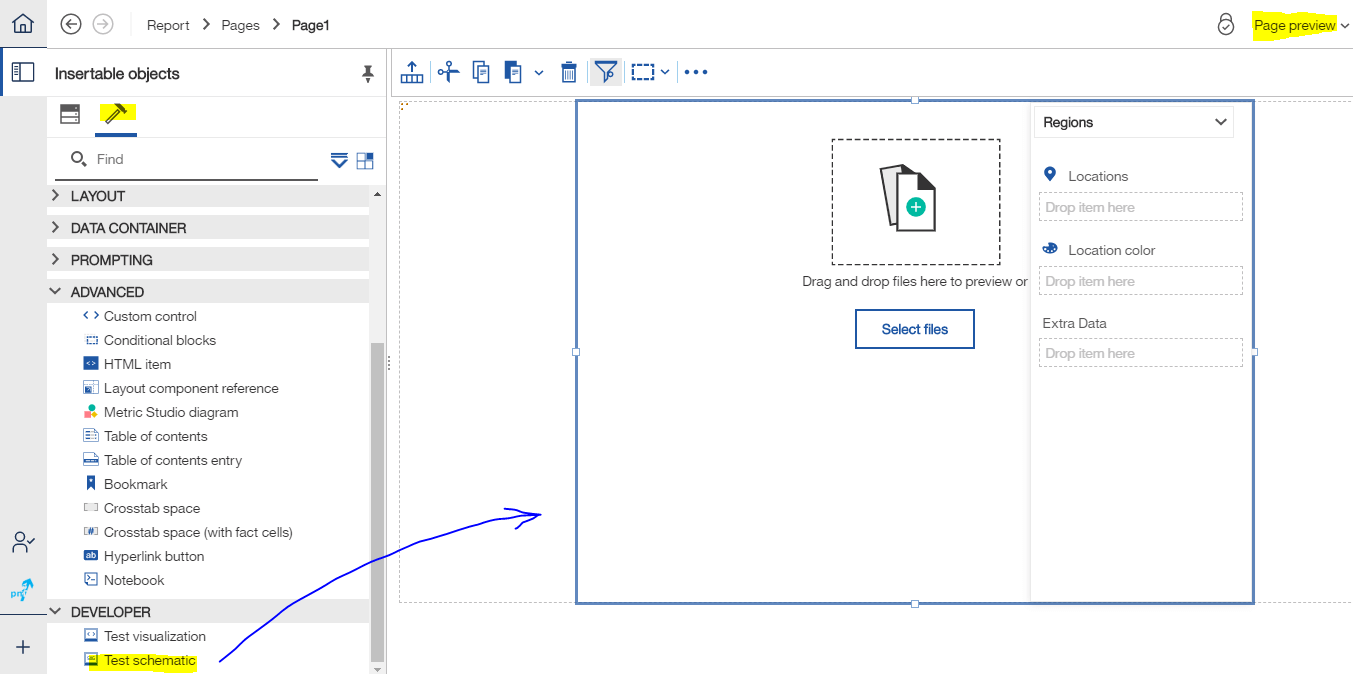
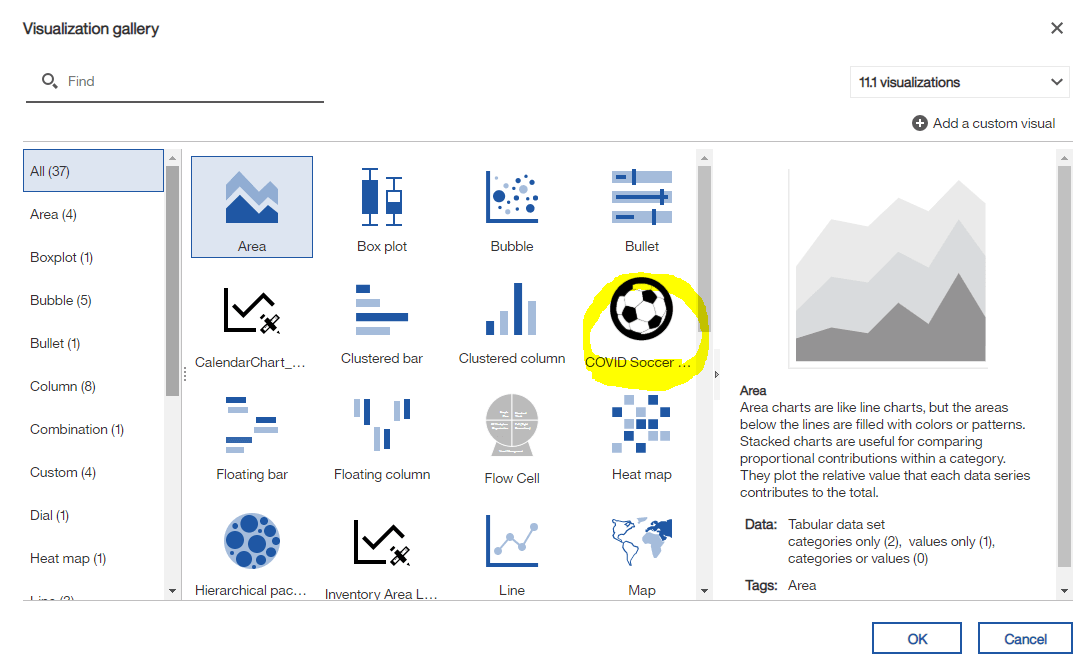
Now fill in the slots with data for both regions and points accordingly (if both are desired…we only used regions in this example). Also, make sure to fill the slot for Extra Data, if you want users to be able to filter on additional values not present in display. After you’re finished, add the svg file(s) by clicking ‘Select Files’ in the widget on the canvas and choosing the svg(s) that you intend to display. Play around with the live preview with your svg(s) displayed. Click different layers, views, and switch images (if more than one svg). Once you’re convinced you’ve modified the svg(s) xml as you intended in order to be able to interact with the graphics, click the pencil icon to create the Schematic Package. From there, you can modify the Package name, description, and icon. The icon will show as the visualization icon when developers are creating new visualizations from the gallery (example below).
Uploading Schematic Packages to Cognos
Once you’re finished creating that Schematic Package, you can download it via the download icon (next to the pencil icon that you previously clicked). This will download the package as a zip file. To actually use this new schematic package, you’ll first need to upload it to Cognos Analytics. To do that, go to Manage > Customization > Custom Visuals and click the upload button. Select the zip file you just downloaded.

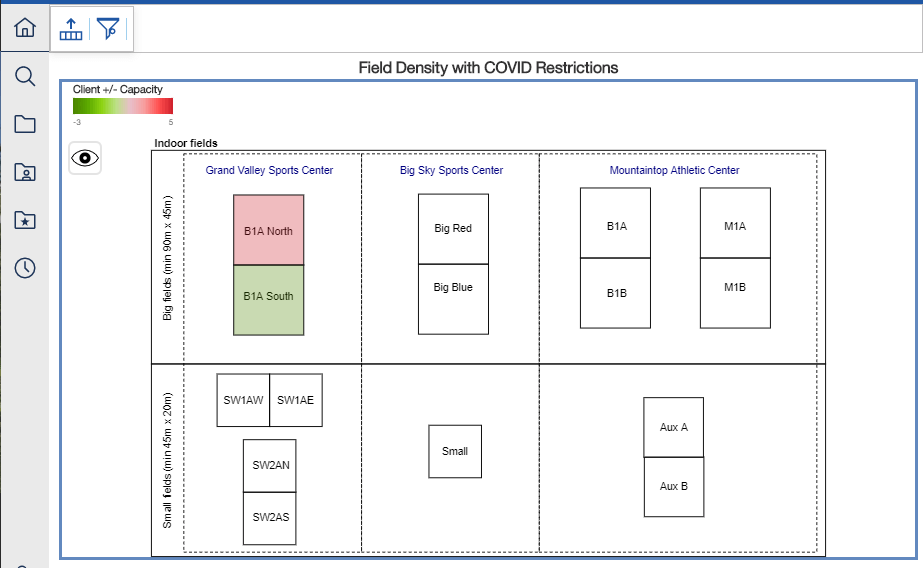
Developers will now be able to select this visualization via the standard visualization gallery and populate it with data…just like any other visualization. In our ‘soccer organization operating in a COVID-19 world’ example, a developer then created a Field Density Report, using our new schematic as its visualization. Using this report, Operations Managers are now able to easily view density for each field, based on current enrollment numbers vs COVID-19 mandated reduced capacity, and see where they have to take action to keep their customers safe.

Using the standard view control, Operations Managers can focus on certain sports centers.

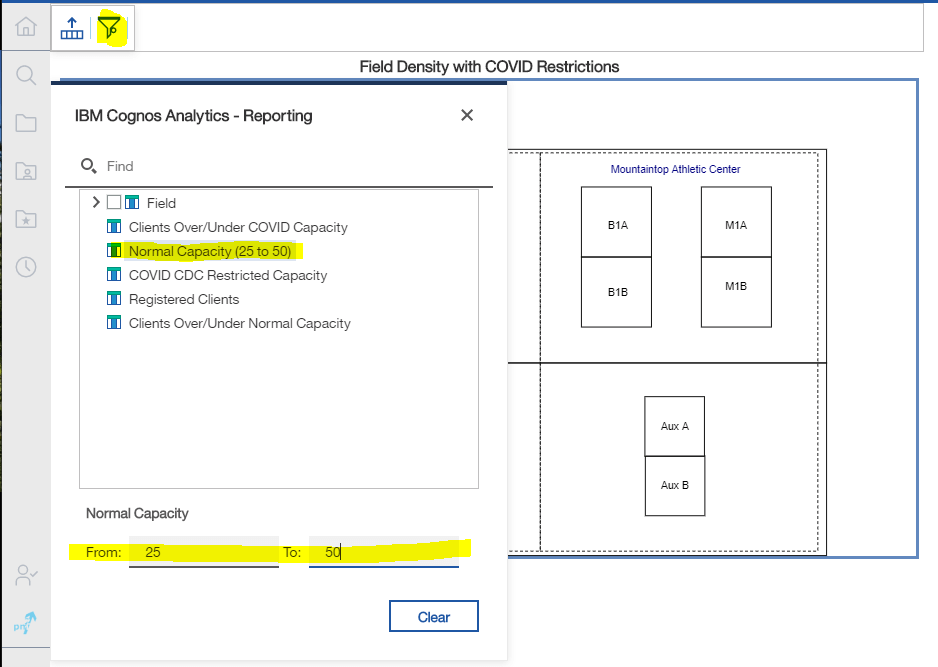
Using the standard filter control, Operations Managers can add additional filter parameters.
Next Steps
PMsquare has helped many customers successfully implement custom schematics. For help pulling your schematics into Cognos Analytics, contact one of our solutions architects.
We hope you found this article informative. Be sure to subscribe to our newsletter for data and analytics news, updates, and insights delivered directly to your inbox.
