

Share


Michael Hovar, July 13, 2020
Get the Best Solution for
Your Business Today!
A Case Study in Data Preparation using Trifacta
I’ve been dealing with large quantities of data for most of my professional life – and some of my pre-professional life. In that time, I’ve been witness to (victim of?) some pretty shocking corporate practices when it comes to squeezing useful analysis out of disparate and disorganized data. Maybe you’ve seen it too:
- Data disgracefully sucked out of home-baked applications never designed for use beyond the ‘90s
- A hacky mainframe system screen scrape
- Completely free form user-submitted information
- Poorly governed external data sources hastily combined with trusted data
- The list could go on…
Enter Trifacta Wrangler, an intuitive and intelligent data preparation tool designed to create order from chaos. There’s nothing my spreadsheet-loving self gets more excited about than well-structured data; but before I get too poetic with my Trifacta hero epic, let’s ground our discussion in a case study. Because when it comes to data troubles, I’ve seen things. So how does Trifacta help?
In one of my past lives, I sold air conditioners. Not off the back of a truck, but in an office cubicle with a computer and a slew of data. Reliable data, but terribly unorganized data. Before I could sell any air conditioners, I had to put them in stores. And before I could put them in stores, I had to figure out what to send where, and when. Standing between me and profits were a series of problems, and I sure wish I had Trifacta then to help me solve them.
Table of Contents
Problem 1: What to send?
During my time in the air conditioner industry, our product line went through a number of overhauls – some voluntary and some resulting from government regulations. What this meant for me was that a product line consisting of about a dozen products was made up of about 30 different item codes. Any given product type had 2-4 different models that filled the same demand in the marketplace. I had a product list, but what I needed was a way of grouping and cross-referencing so I could make sense of my sales and inventory data.
As much as I may love spreadsheets, it was painful trying to do this in my previous life with only Excel in my toolbox. If only I had Trifacta at the time, which can solve this problem easily with native pattern recognition. Let’s take a look.
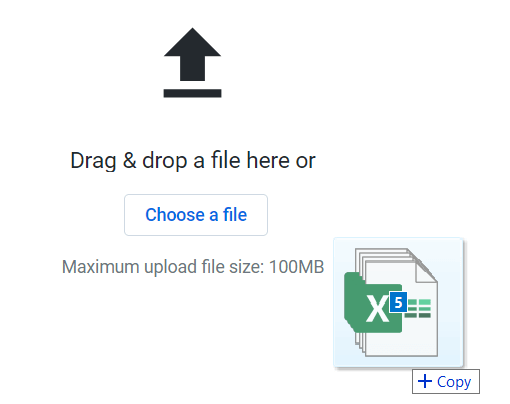
I’ll upload my simple 2-column Product List with item codes and descriptions of the air conditioners carried over the past few years. (Mind you, I’m uploading local Excel files because Trifacta makes that so easy, but Trifacta also connects to cloud object storage and relational databases.)
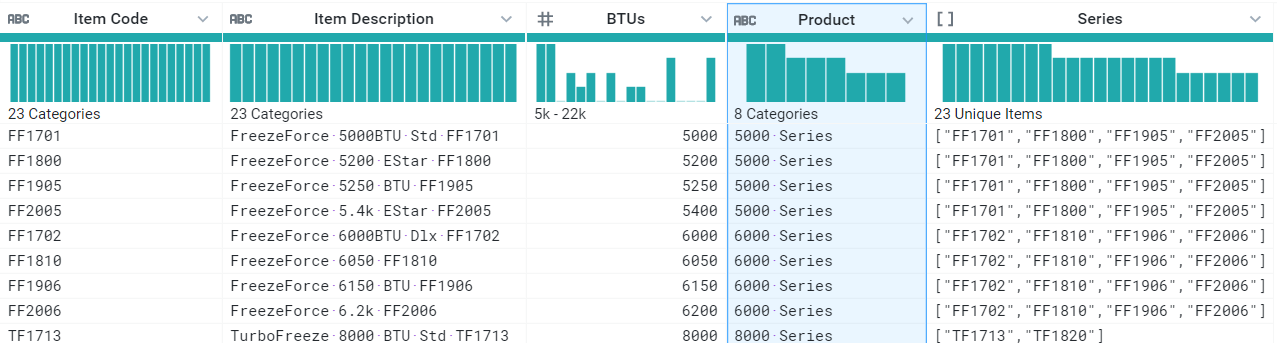
Our goal is to make a list of items associated with each product type. And when we take a look using the pattern browser, we see that each Item Description contains a numerical value in the middle of the string. This turns out to be the BTU (energy) rating for the model – which is how we differentiate between products. So if we can extract this value to a column, we may be in business.

Sure enough, Trifacta allows us to effortlessly extract these numbers, apply a few cleanup steps, and VOILA! We’ve got a Product group for each item in our lineup.
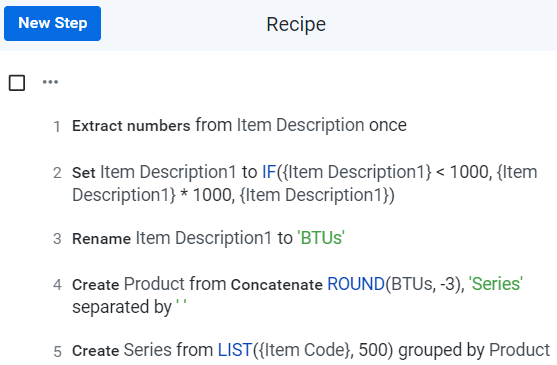
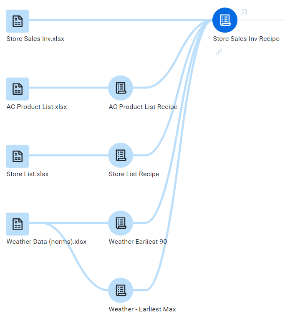
How did we reach this point? Trifacta works its magic using what it calls “Recipes”. The creation of recipes is guided by you, the user—but you don’t have to write the recipe by hand. Simply follow suggestions or choose functions from the toolbar, and Trifacta will guide you through the process. Seemingly complex transformations can be created with just a few clicks. And once my recipe is created, it can be applied to my data set over and over. So any time my air conditioner Product List changes, assuming it maintains the same basic shape, I can apply this recipe and get my Product series listings just as I did now. And yes, this can all be automated!
Problem 2: Where to send it?
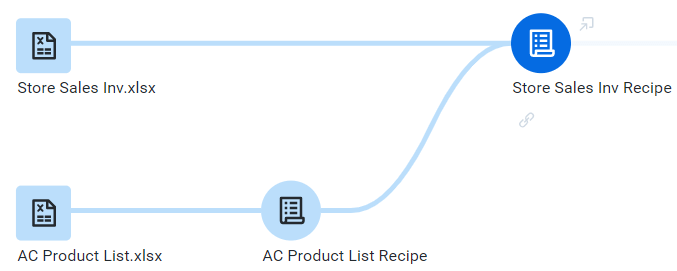
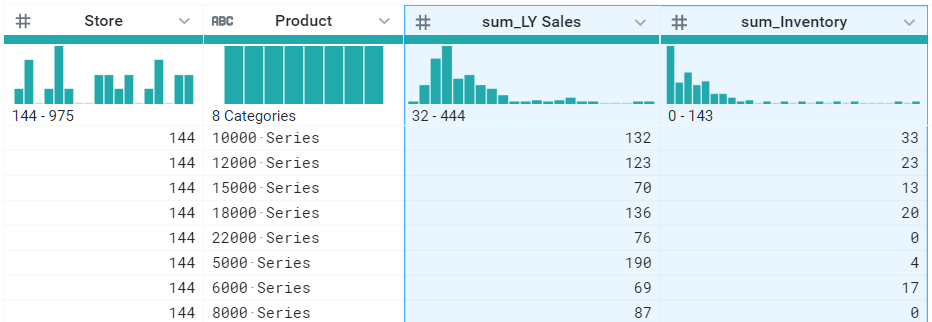
Now that we know what our products are, naturally, we want to know how many we’re going to sell. The problem is that our sales and inventory data, which I’ve handily uploaded to Trifacta, is all reported by Item Code. We need to look at Products rather than items because we’ve been selling up to 4 different item codes that fill the same niche in our market. So to make use of the data we have, let’s begin with a join to the Product List we’ve already tidied up. We’ll do a left outer join on Item Code.
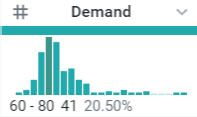
Once that’s in place, we’re just a simple “Group By” away from consolidating all of our sales and inventory by Product instead of Item Code. We can also add a simple calculated column to show our net Demand (sales – inventory). The data histogram automatically provided at the top of each column will even give us an idea of the distribution of Demand quantities at a glance: mostly between 40-100.
Now we have a list of sales, inventory, and demand by Store and by Product. We’re almost ready to make some sales!
Problem 3: When to send it?
The final dimension to our sales question is time. And in the world of heating and cooling, time is tied to weather. So I’ve taken the liberty of pulling some weather statistics by zip code from NOAA. We’ll also need our store addresses so that we can get a zip code for each of our stores. Joining these to our existing work, we’ve got some new columns to work with.

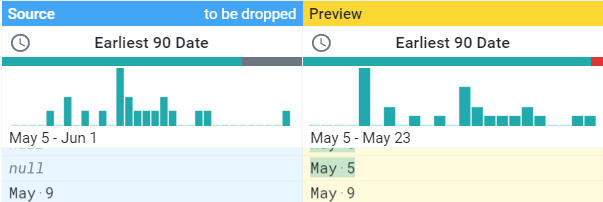
Using straightforward aggregate functions, I have extracted from the NOAA weather data two key dates in summer seasonal sales: the earliest date the temperature normally hits 90, and the earliest date the temperature normally peaks. Gaps in the data can be replaced with default values, as needed.
Equipped with this data now joined into our sales and inventory, we have all the information we need to apply a strategy of inventory deployment to get units into the store in time for the summer-selling season. Say, we want to have 80% of LY sales on hand before the temperatures reach 90, we can add a calculated column for our Initial Shipment of product:

Success!
At last, we have reached our goal. We successfully wrangled data from several disparate data sources and created a meaningful table to answer our questions: what to send, where to send it, and when. If this were a live application, I could even connect this to a database or application output to feed current inventory values, which would automatically adjust my demand. This is, of course, just one of the nearly unlimited scenarios in which Trifacta could make your life easier. The PMsquare Services team would love to help you explore how Trifacta can transform your data from chaos into insights that drive business value.
Next Steps
We hope you found this article informative. Be sure to subscribe to our newsletter for data and analytics news, updates, and insights delivered directly to your inbox.
If you have any questions or would like PMsquare to provide guidance and support for your analytics solution, contact us today.