IBM Planning Analytics Overview

IBM Planning Analytics offers several ways to enhance your reporting capabilities. Along with the powerful TM1 engine, you get integration with Excel, Planning Analytics Workspace (PAW), TM1 Web and Cognos Analytics.
Web-based Planning Analytics Workspace is designed as a dashboarding tool allowing users to create their own views and charts.
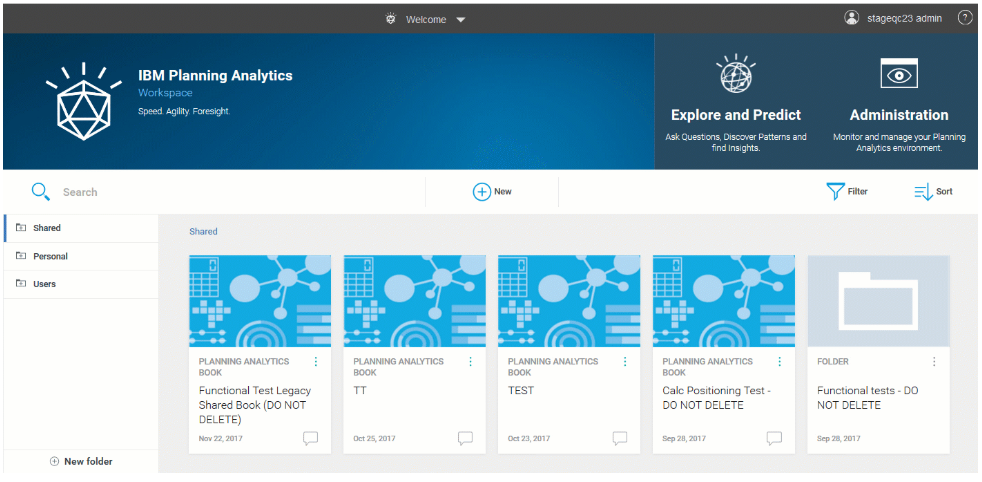
Planning Analytics Welcome page
Planning Analytics Workspace (PAW)
Starting with a basic cube view, a user doesn’t need to enlist a report developer to produce an on-screen crosstab, chart or combinations or both. You can also integrate Excel web sheets to house reports, input templates and action buttons to run TM1 processes. PAW provides the tools to build clean, simple templates for data entry directly into TM1. Within PAW you can build custom cube views and subsets that can be saved to a personal folder or, given the user’s authorization, the view or chart can be shared. Although Workspace doesn’t allow for direct printing of a visualization, you can export it to Excel in a raw form and use the data to format printable reports. Workspace does not have the flexibility of Cognos Analytics, but a minimally trained user can create a useful visualization quickly. Note that charts are not exported to Excel, only the crosstab supporting the chart is exported. Since Workspace is web based, distribution can be done through access to the Workspace website and TM1 security. New features, such as action buttons that can run processes, make this an application for power users as well as novices. With six updates so far in 2019, IBM is putting serious efforts into transforming PAW into a premier analytics tool.
PAW - Pros – easy for a user or developer to create useful web-based visualizations; users can access any TM1 object they have authorization to use. Since PAW is web-based, crosstab views and charts are easily distributed. IBM is frequently adding new features. Cons – printing can only be done through Excel and the Excel based data needs to be formatted to create professional looking reports; graphs are not exported to Excel.
Planning Analytics for Excel (PAX)
Planning Analytics for Excel (PAX) contains the full suite of Excel functions with additional TM1 functions. You can directly access TM1 cube views which allows users to have up-to-the-minute data in their Excel reports. Users can create custom cube views which can include custom subsets of dimensions. Users can build custom report templates that are fed with live TM1 data. You can combine more than one cube in a single report using charts or crosstabs as objects.
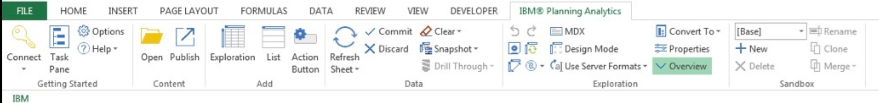
IBM Planning Analytics ribbon

PAX worksheet showing a crosstab and related charts.
Viewing Data in PAX
There are four ways to view data in PAX; Lists, Explorations, Dynamic Reports, Custom Reports and Quick Reports all of which can be published as web sheets to TM1 Web.
Lists
A List creates a combination of rows and a single column that can be added to a worksheet via drag and drop. With lists, you can view all of the members in a dimension easily and quickly. Use Lists to create a list of members in a dimension or a quick simple report as shown below.
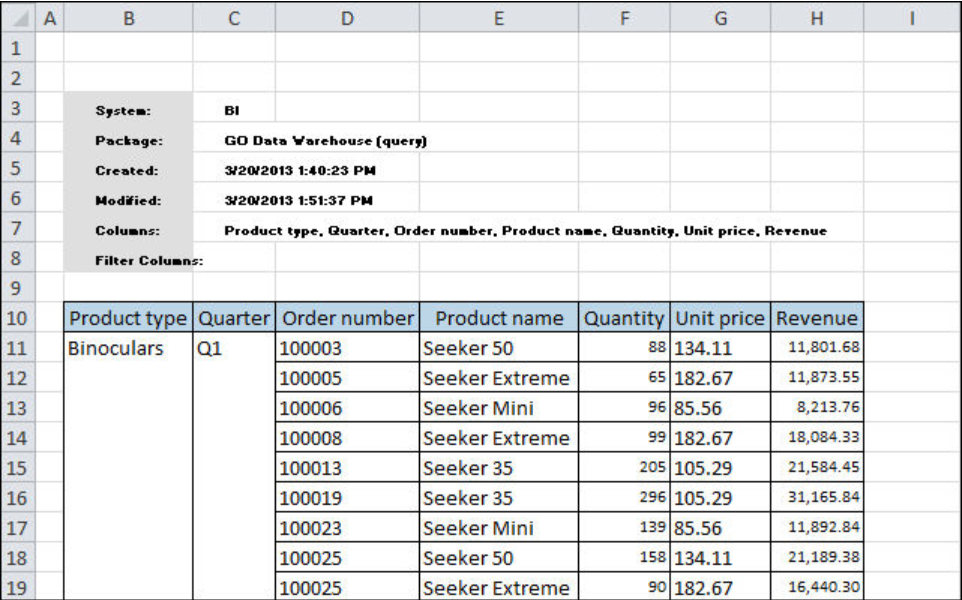
Example of List in PAX
Explorations
Explorations are crosstabs of rows and columns that also contain a context area above the cell which can be used to filter data in the Exploration crosstab. The IBM Task Pane that appears on the right side of the screen provides all the TM1 objects the user can access including cubes, views, dimensions and dimension elements. The task pane is also where your workbooks are organized. Use Exploration Views to compare, manipulate, filter and drill into data to discover relationships between data and to quickly answer specific questions. Use explorations to answer simple questions like “what were our travel expenses in June for the West Coast region?” Build interactive views that can be shared with other users. I like to start a report with an Exploration because you have everything you need to quickly build a basic, well formatted report.

Simple Exploration View (note the IBM Task Pane on the right)
Quick Reports
A Quick Report also includes rows, columns and a context area (you can use an existing Exploration as a starting point). You can build multiple Quick Reports on a single worksheet and you can use multiple data sources. Quick Reports allow users build in complex layouts, Excel charts, formulas and formatting. Use Quick Reports when you want to create highly formatted reports from one or more data sources with fixed rows and columns. A Quick Report is useful when you present data or send workbooks to other team members who do not have IBM Planning Analytics for Microsoft Excel.

Unformatted Quick Report in PAX
Custom Reports
Custom Reports are built with TM1 worksheet functions*. You can build a Custom Report from an Exploration, Quick Report, cube view or from scratch. Custom Reports can do everything a Quick Report can do plus you can move cells, rows and columns. Use a Custom Report when a Quick Report cannot achieve the desired flexibility. We use Custom Reports when we need to control which cells contain data. Using TM1 Excel functions (which behave like excel formulas), we can place data anywhere our requirements dictate.

Using the Custom Report functionality, we can arrange data however we like within the worksheet.
Dynamic Reports
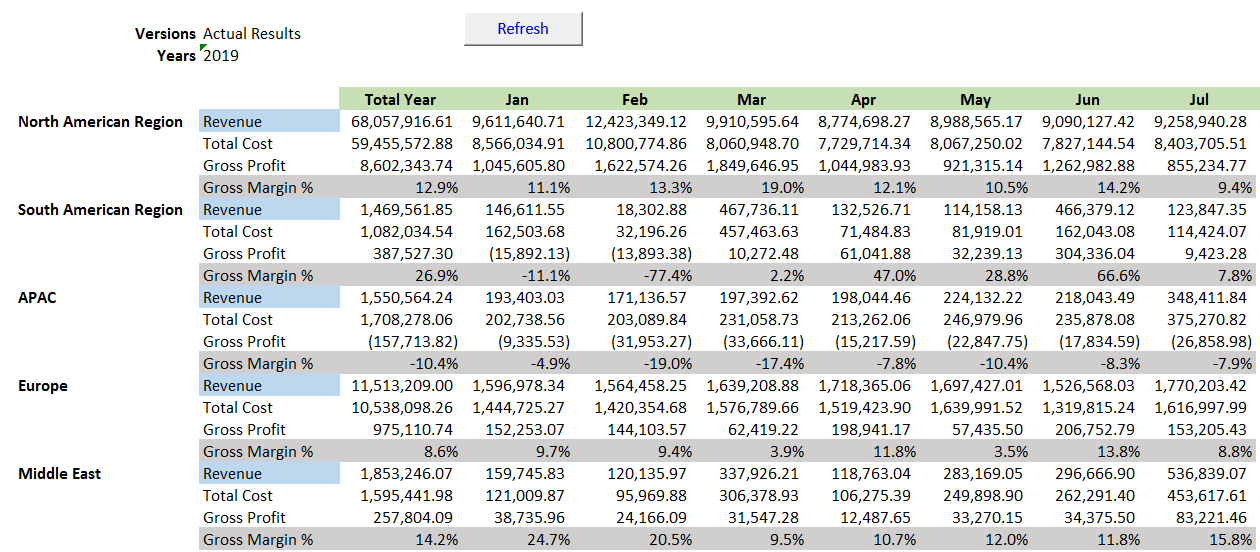
Dynamic Reports are also created using TM1 functions. Dynamic Reports can have dynamic row members with customized formatting with the ability to expand and collapse rows You can use Excel calculations and other Excel features creating more complex reports while still using interactive features, such as expanding and collapsing rows.

When you create a Dynamic Report, the IBM Planning Analytics ribbon changes and includes a Dynamic Report group
Dynamic Reports support features available in explorations and Quick Reports, such as selectable context members, stacked row and column dimensions, expandable/collapsible consolidations (rows only), zero suppression (rows only), and inserting rows and columns (with some restrictions).
With A Dynamic Report, you can use Excel formatting to highlight specific rows as shown below to feature areas of interest for the reader. In this example the Revenue label is highlighted and the entire row of Gross Margin % is highlighted. Rows can be expanded and collapsed and the formatting will remain consistent for these rows. You can also incorporate Action Buttons to run TM1 processes or Excel macros.
*TM1 worksheet functions return a numeric or character value from a TM1 source and can include functions that retrieves a value from a TM1 cube, dimension, dimension elements or other TM1 metadata. TM1 functions can also write back data to TM1 cubes.
Users can also directly update data in TM1 through PAX, including bulk uploads using TM1 processes via action buttons. PAX can be connected to Cognos Analytics data using Framework Manager packages. Reports developed and formatted in PAX can be emailed or printed just as you would in Excel. Security for PAX is applied through TM1 security.
TM1 Web
TM1 Web is a web-based application that is built using TM1 cube views and Excel files. TM1 Web enables a user to drill, pivot and filter TM1 data in crosstabs and charts.

TM1 Web using a cube view
TM1 Web can incorporate highly formatted Excel files which can be used as templates for data entry, reporting and executing processes. These templates can include a combination of a crosstab and charts to create a powerful user interface to TM1.
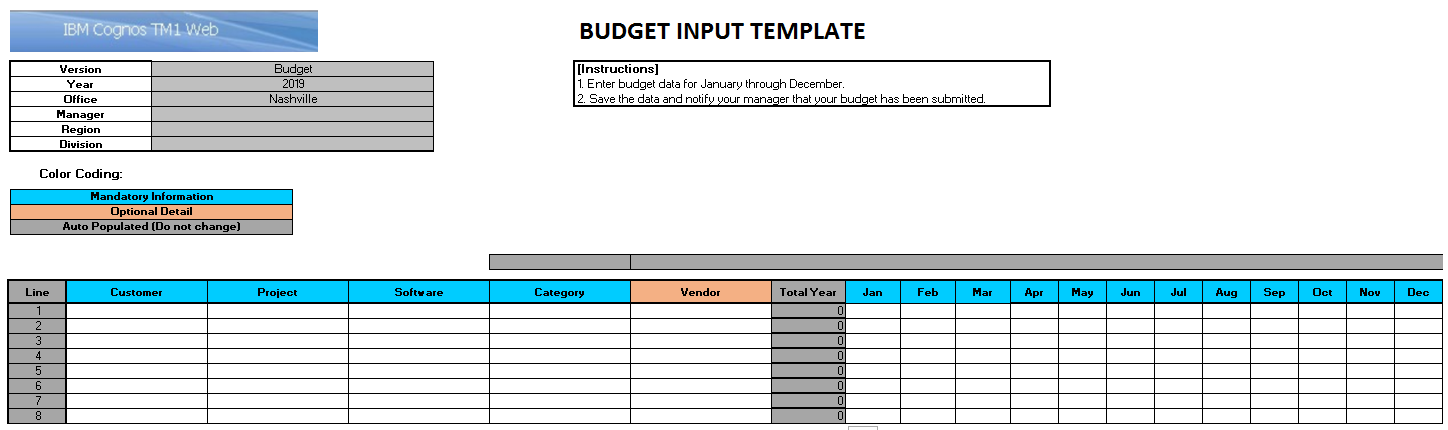
Excel Template for TM1 Web
TM1 Web templates can be exported to Excel as snap-shots (not connected to TM1) or as a Slice to Excel (connected to TM1) or as a PDF. TM1 Web Excel templates downloaded to Excel maintain their formatting. TM1 Web cube views downloaded to Excel are rendered as raw data in Excel. Reports residing in TM1 Web are distributed simply by allowing user access through TM1 security and to the TM1 Web application. TM1 Web supports several Excel functions including Date and Time functions, Logical functions, Financial functions and Lookup and Reference functions to name a few. Web programmers and TM1 application developers can use the TM1 Web application programming interface (API) to incorporate TM1 Web objects into custom web pages, applications, and dashboards. TM1 Web is secured through TM1 security.
All of these applications can be configured to allow users to input and report on TM1 data which makes them more interactive than Cognos Analytics alone.
Conclusion
With IBM Planning Analytics you can provide a wide range of reporting options including self-service options for all skill levels within your organization. If you already use Planning Analytics, make sure your organization is using its full reporting potential. We hope you found this article informative. Be sure to subscribe to our newsletter for data and analytics news, updates, and insights delivered directly to your inbox.
Next Steps
If you have any questions or would like PMsquare to provide guidance and support for your analytics solution, contact us today.
