What's New in IBM Planning Analytics - Version 2.0.49

What’s Covered
Dynamic Shapes and Images in Websheets
Changes to How Hierarchies Are Sorted in Workspace
Enabling Security Access for Processes
Use Dynamic Shapes and Images
In TM1 Web, you can dynamically insert shapes and images anywhere in your websheet where you’d like the image to change when the value of a cell changes. You can dynamically insert logos, employee pictures, flags, product images, and more.
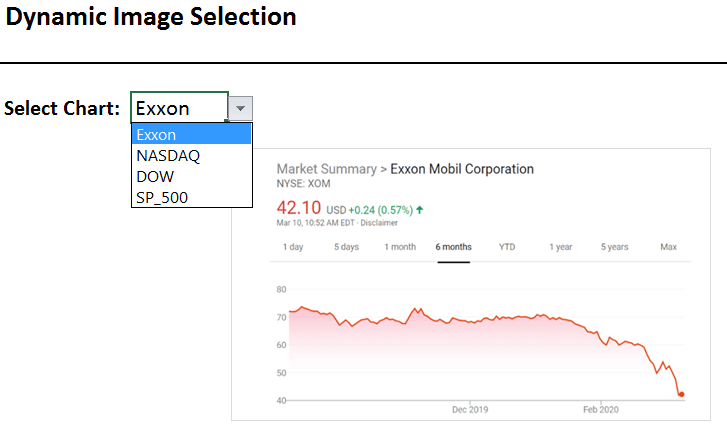
A simple demonstration of this can be done using a drop-down list that corresponds to a set of charts. In this case, it’s a list of stock and stock index charts. We have a spreadsheet called Dynamic Image Selection and in the drop-down (cell C3) there is a list of four elements. Upon selecting a stock or stock index from the list, the chart appears in cell D6.
A dynamic image can be displayed in cell D6 by assigning a named range that contains an INDIRECT or INDEX-based formula to an image object. In this example, we are using an INDIRECT based formula. The formula translates to a cell reference where an image is anchored to the referenced cell.
To support this feature, TM1 Web keeps the assigned formula, and when it recalculates, TM1 Web evaluates the named range formula to a cell reference. The named range is the name of the cell containing an image. Each cell containing an image will be a named range of one cell. Using this cell reference, TM1 Web can then update the image object's file name to match the referenced image.
Steps
Place each image you want to use in its own cell. Multiple images should be in a single row or column. See the illustration below.
Name each image-containing cell, the name of the cell should exactly match the selection that triggers the image. For example, if you want to bring up the image of a NASDAQ chart and the selection from a drop-down is “NASDAQ”, then name the cell containing the NASDAQ image “NASDAQ”.
In the illustration below, cell A2 is named “NASDAQ”, cell A3 is “DOW” and cell A4 is SP_500. Note that the associated reference to each image is in column B and the values in column B match the names of the images in column A. The values in column B comprise the elements in our drop-down.

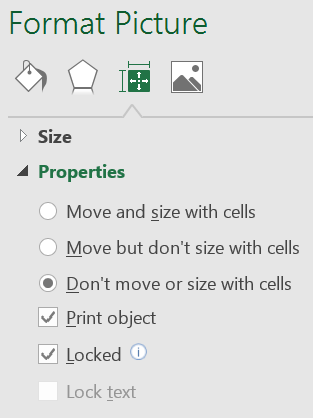
Pro Tip – select the images and go to Format Picture, select Properties and click on “Don’t move or size with cells”. This will keep your image from being distorted if the row or column dimensions change.
Create your drop-down list. In the illustration above, column B contains the elements that will make up the drop-down list.
Select the cell where your drop-down list should appear.
Go to the Data tab, then Data Validation.
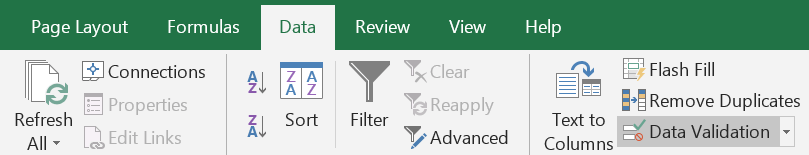
In the Data Validation window:
Select List under Allow.
For the Source, enter the range that contains your list. In our example, the range is in the Charts sheet, in column B, rows 1 through 4.
Click OK.

Next, copy one of the images and paste it into the cell where the dynamic images should appear. In our example, the image was pasted into D6.
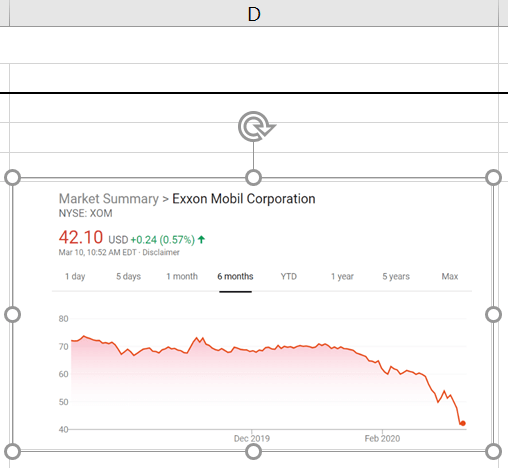
With the image highlighted, go to the Formulas tab and select Name Manager and click on New.
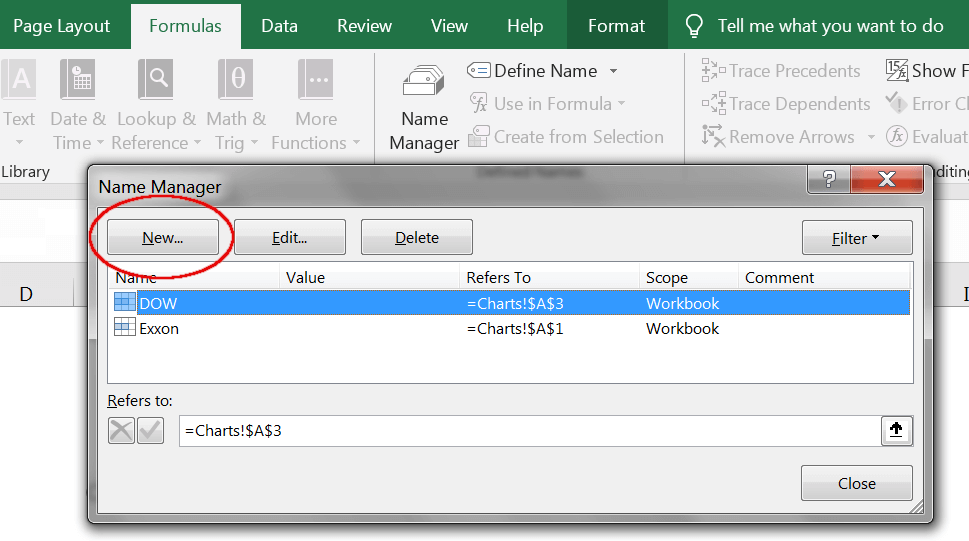
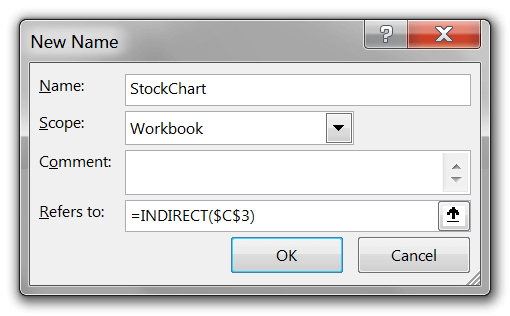
Enter a name for the image\location and in the Refers to: box, enter the INDIRECT function and the cell reference as shown below. INDIRECT($C$3) Click OK.
INDIRECT() translates what it sees in a cell to a cell reference or address. In this case, the Indirect function will see what’s in the cell that contains our drop-down list. When NASDAQ or any of the other elements in our list are selected, Indirect will translate it to a named range that matches the element selected.
With the image still highlighted, in the Formula Bar change the formula to “=StockChart”. This will be the formula for any image that is presented in this cell and the Indirect function will be operative for any of the images.
Go to your drop-down cell and select any of the elements and watch your image change.
Hierarchies Are Now Sorted Alphabetically in Workspace
Hierarchies are now sorted alphabetically in the content tree, and in the set editor so that the order of hierarchies is predictable. This does not require a configuration change. It is now a default behavior in Planning Analytics.
The sort order for hierarchies is determined on the following basis:
The default hierarchy (typically, the hierarchy with the same name as the dimension) appears first.
The all-leaves hierarchy (typically called Leaves) appears last.
All other hierarchies are sorted alphabetically by their caption.

Enable Security Access for Processes
By default, security access is disabled when you create a new process. This means the process cannot modify security data. If you want to allow a process to modify security, you must enable security access for that process.
Note that you must have an Administrator or Modeler role in Planning Analytics Workspace and be a member of either the ADMIN or SecurityAdmin group in TM1 to enable security access.
To enable security access:
On the Script tab of a process, click the Options button, then click Enable security access.

Next Steps
We hope you found this article informative. Be sure to subscribe to our newsletter for data and analytics news, updates, and insights that are delivered directly to your inbox.
If you have any questions or would like PMsquare to provide guidance and support for your analytics solution, contact us today.
