Mapping in Cognos

Custom Boundaries with GeoJSON
IBM’s partnership with MapBox delivers modern mapping capabilities and a custom boundary feature unleashes the possiblity of powerful new geospatial analytics in Cognos.
Background
IBM has a partnership with MapBox—it is MapBox technology that is used to delivery the modern geospatial capabilities in C11
Custom boundary feature added in Cognos Analytics (11) R11
Documentation provided by IBM assumes that you already have a GeoJSON file
Through MapBox studio you can draw custom boundaries by hand… but that’s not generally what we want to do. Instead, a common use case is to have a set of standard geographic elements (such as zip codes), and to want to combine them to draw the custom boundaries or “territories”. That’s what we will do here.
How Does this Cognos Feature Benefit Your Business?
Become your organization’s hero by bringing into your organization:
A simple way to visualize geographic information your business is already tracking in a manner that can unlock new insights
Target marketing campaigns, design sales strategies, optimize inventory, etc.
A tangible, accessible tool to evaluate ROI in key areas of the business
Learning Objectives
This blog post will show you how to do the following:
Download a starter Shapefile
Prepare a grouping file
Use MapShaper to create a GeoJSON file of your custom boundaries
Import a custom GeoJSON file into MapBox
Configure Cognos to access the custom boundaries imported in MapBox
Before you Start
Download and install Node.js & Mapshaper
Download the executable from http://nodejs.org/ and run the installer.
Open a Windows command line to download and install MapShaper locally
git clone git@github.com:mbloch/mapshaper.gitcd mapshapernpm installCreate a MapBox account
The exact steps to create a MapBox account are outside the scope of this post, but it is simple. Just go to http://mapbox.com and follow the steps to sign up and create an account, or have login information handy if you already have an account or if a company account will be used. A free account is totally sufficient for the what we will be doing.
Build your Custom Boundaries
Download a starter Shapefile
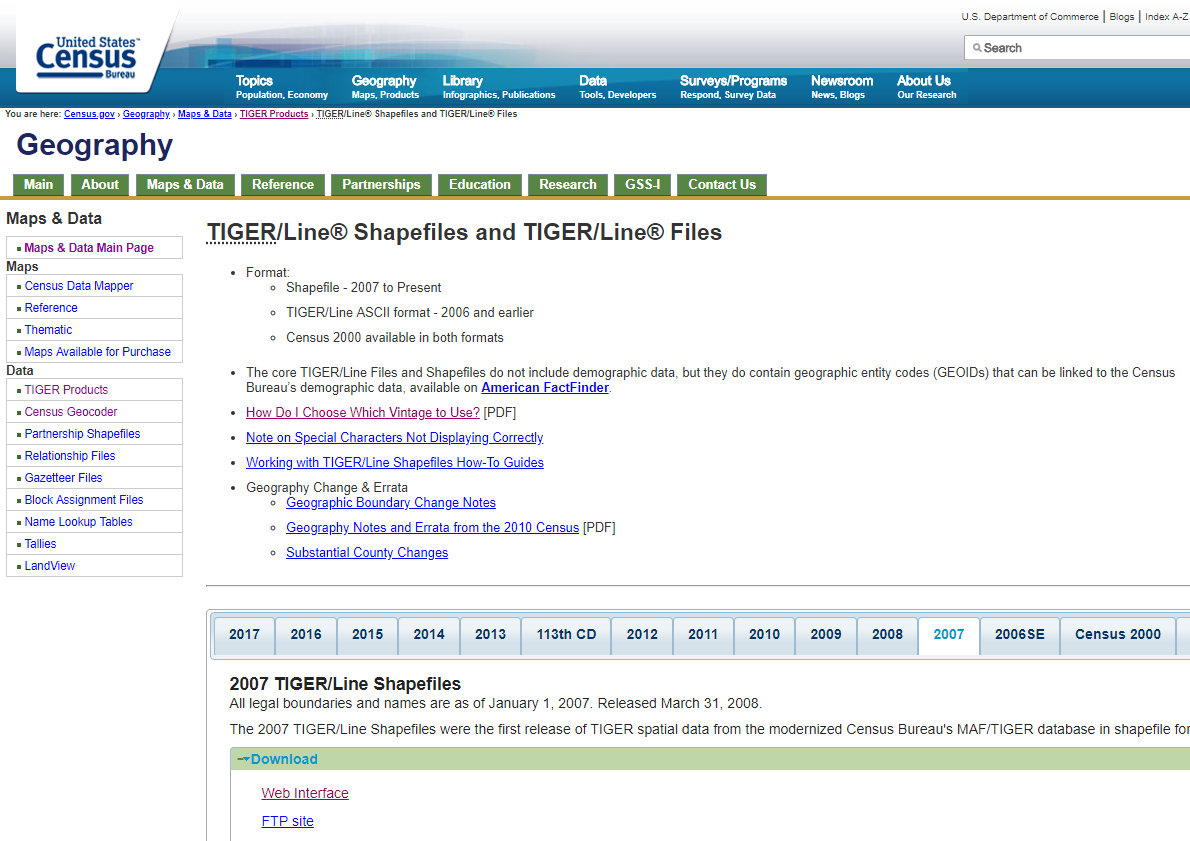
This post is about combining US zip codes to create custom polygons. Therefore, we'll start with a shapefile of zip codes directly from the US government. These can be found here:
https://www.census.gov/geo/maps-data/data/tiger-line.html
Note that these are technically not maps of all possible zip codes, but rather "Zip Code Tabulation Areas". Understand more about ZCTAs here:
https://www.census.gov/programs-surveys/geography/guidance/geo-areas/zctas.html
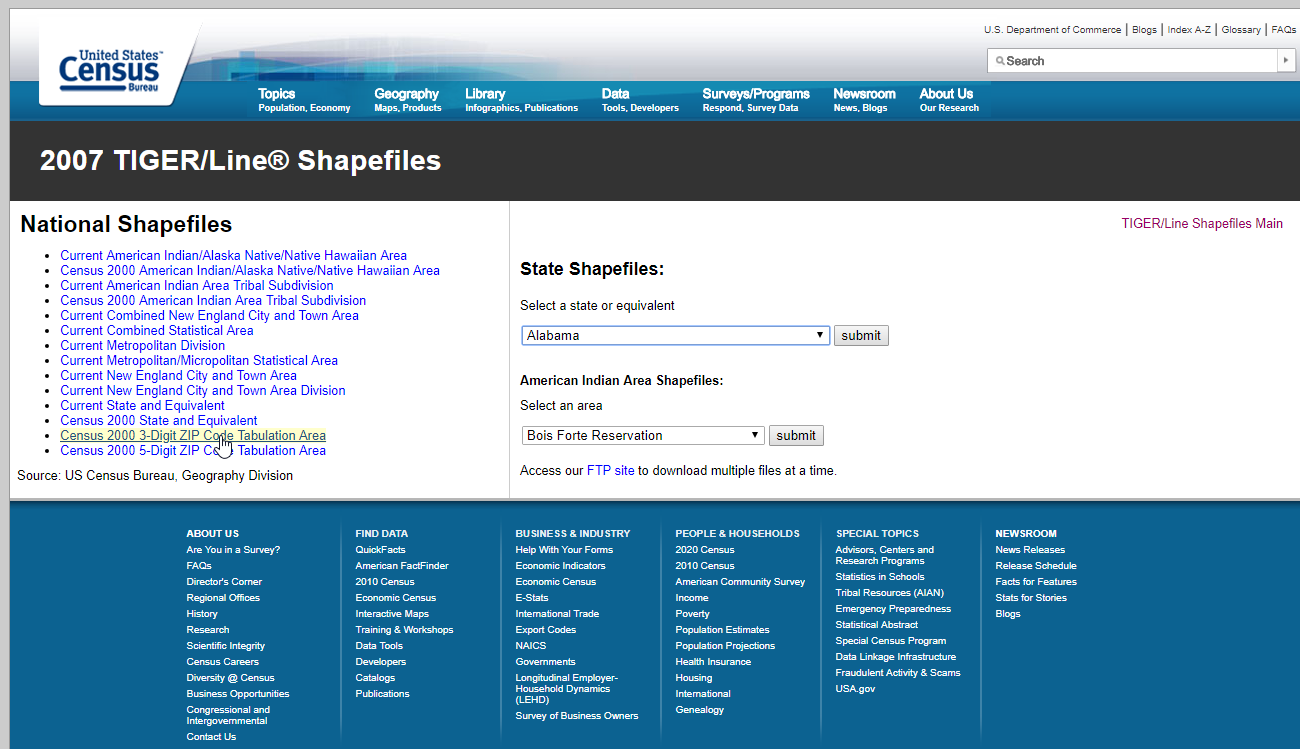
The short version is that for "general purpose" use, the 2000 census 3-digit ZCTA file is probably your best bet. Otherwise you'll end up with lots of holes in your map. However, if it's important that the lines on your map are as accurate as possible, you may consider the 5-digit ZCTA files (the 2010 version will still leave holes).
Note that there are other providers of this data, but other accurate and reliable sources appear to all require licensing as of the time of this writing, while as the census data is freely and publicly available.
Create the grouping file
In order to group existing zip codes into new custom boundaries, you will need a CSV file with two columns:
1. Grouping Field - These will be the names of the new custom polygons, and the field that your data source in Cognos will eventually use to populate the map
2. 3-digit zip codes - This is the field you will use to join to the existing boundaries in the Shapefile you just downloaded. If your data has only 5-digit zip codes, you may be able to simply take the left 3 digits of the zip code in order to derive the 3-digit code to be used for the join.
The CSV file should include column headers.
Creating the GeoJSON
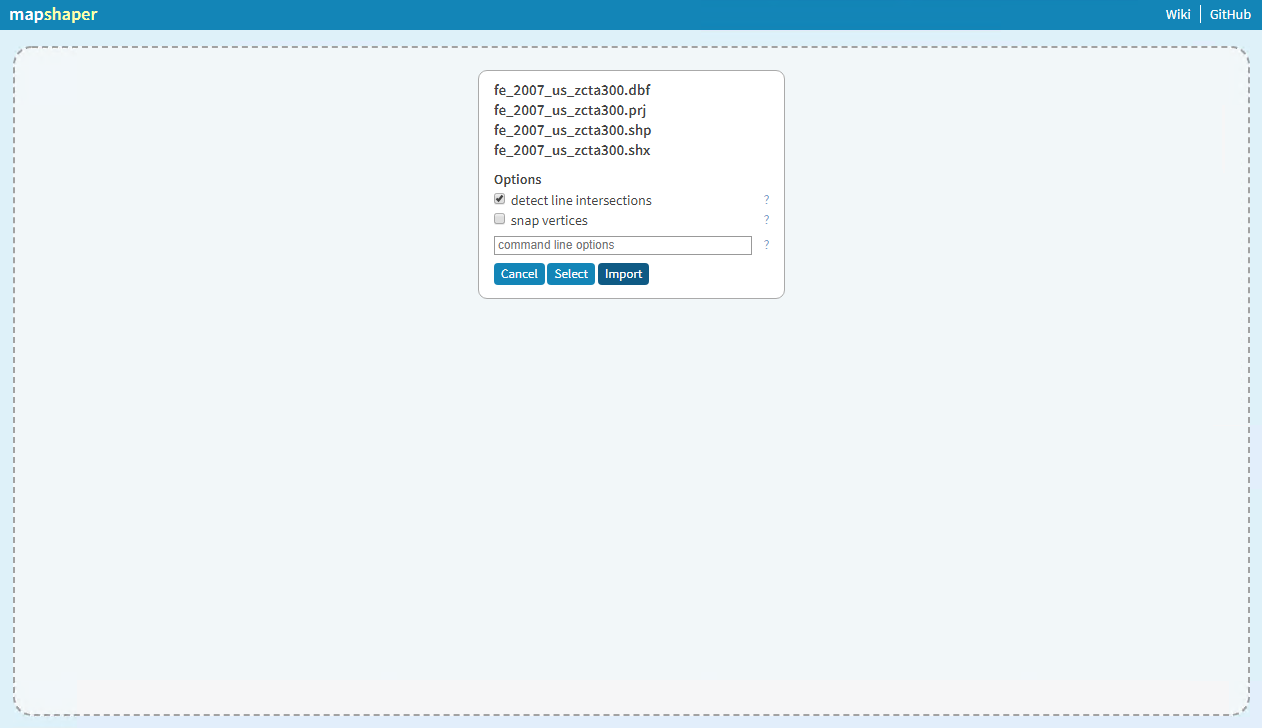
From the Windows command line, run the command to open Mapshaper (will open in a browser):
mapshaper-gui
Select the shapefile archive you downloaded (you can leave it zipped), and import with default options.
Once the shapefile has been imported, click the "i" icon on the right side of the screen (which will allow you to click on polygons to see information about them), as well as the "Console" button at the top right (which will open up the console/command line bar).
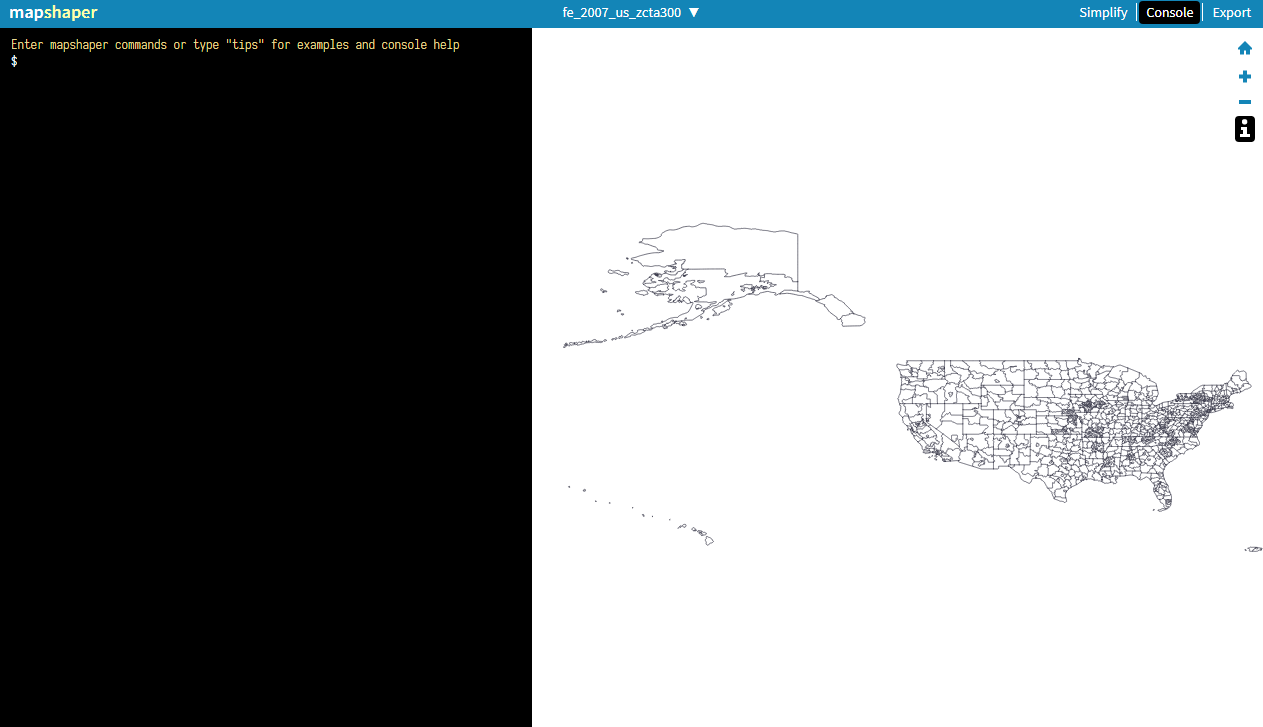
You now have a map loaded with 3-digit US zip codes. If you click on a polygon, you can see the 3-digit zip code for it (ZCTA3CE00) as well as the value of a few other fields.
Now it's time to add the CSV that you are going to use to group the zips. To do so, click the dropdown arrow at the top of the screen and select "Add a file" (or, just drag and drop the file anywhere on the screen).

Since your 3-digit zip codes will include some with leading zeros, we need to specify a command line option upon import so that these aren't interpreted as numbers, losing the leading zeros. If your zip field is named "ZIP", the command will be:
string-fields=ZIP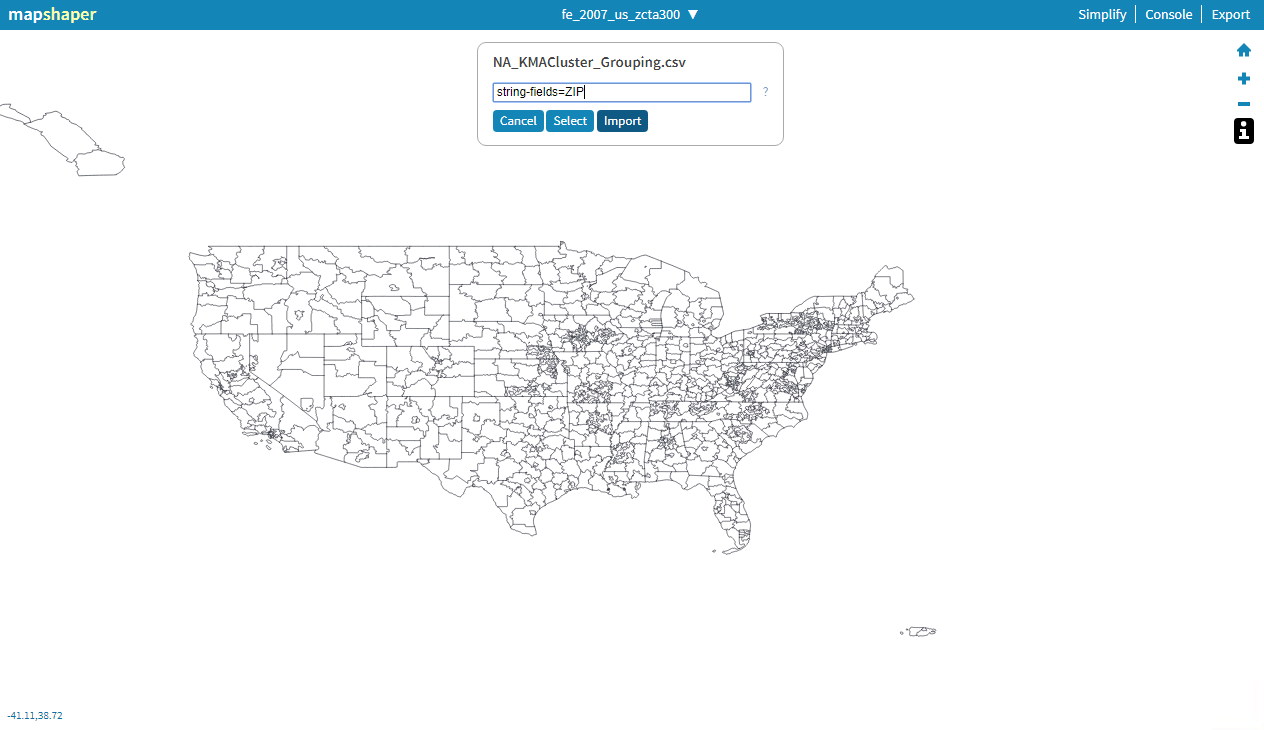
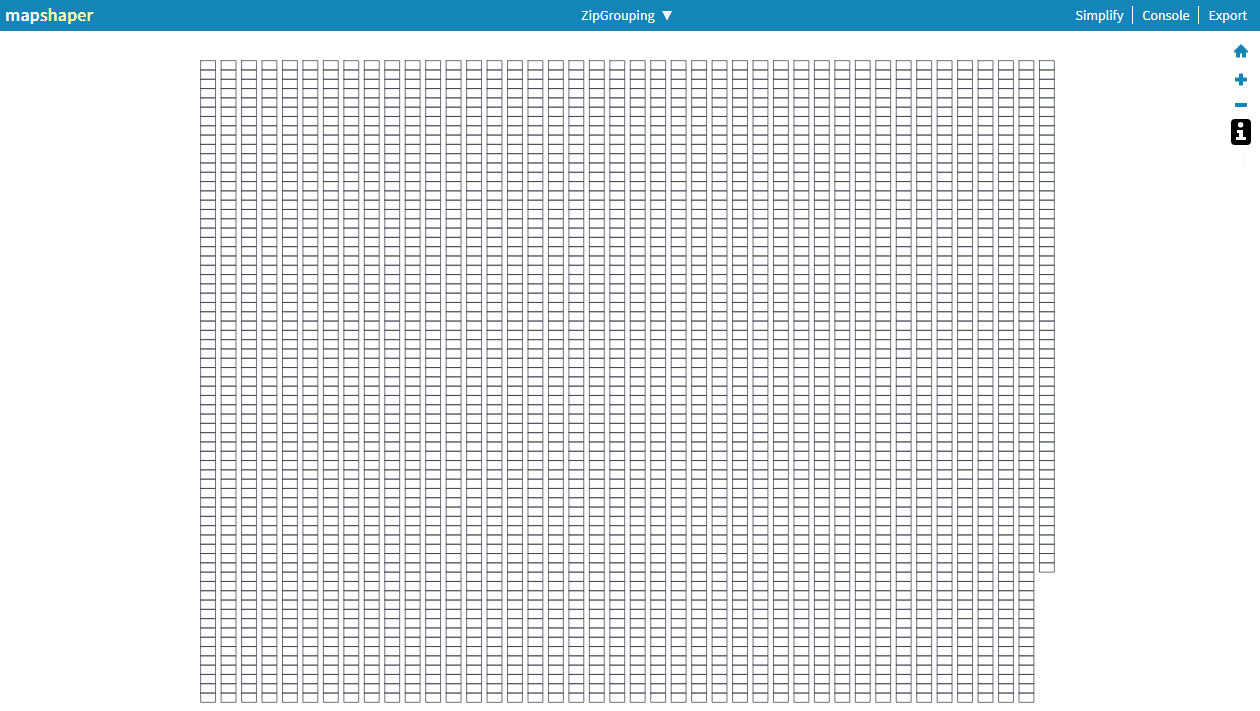
Since there is no location/shape information encoded in a CSV file, MapShaper simply displays the file as a series of boxes. If you click on a box, you can see the values of the fields that make up that record.
Now it's time to do some command line work. Before beginning, switch back to the map view (e.g. fe_2007_us_zcta300) using the drop down at the top of the screen. Then you're ready to issue the commands that will create the custom polygons!
Join together the CSV with the shapefile (sending unmatched and unjoined records to separate layers for review)
-join ZipGrouping.csv keys=ZCTA3CE00,ZIP unjoined unmatched -infoGet rid of all the lines delineating zip codes, leaving only those that outline the new custom polygons.
-dissolve GROUPING_CODEDelete any areas that weren't assigned a grouping code
-filter 'GROUPING_CODE !== null'Look at that—you now have a map with custom boundaries!
It’s worth checking the “unmatched” and “unjoined” layers to make sure that nothing important was missed. Unmatched will have a list of any zips in the map shapefile that weren’t matched to your custom grouping file. Unjoined will contain any zips in your custom grouping file that couldn’t be joined to the map.
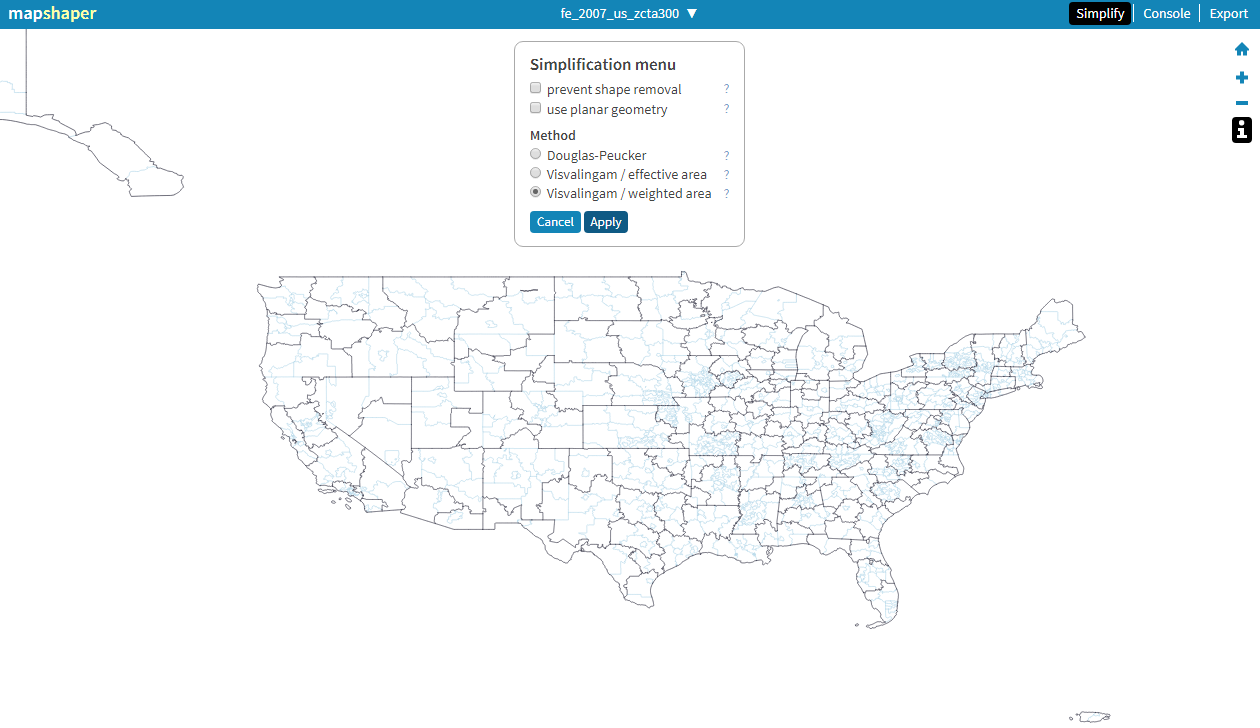
Your next step is to simplify to minimize your file size. To do so, just click "Simplify" at the top right of the screen, click "Apply" to the default options, wait a few seconds for MapShaper to do some calculations, and then drag the slider as far as you can to the right without sacrificing too much detail. The more you can simplify, the smaller your file will be and the better your performance will be when rendering and zooming. (You very well may be able to go down to about 1%.)
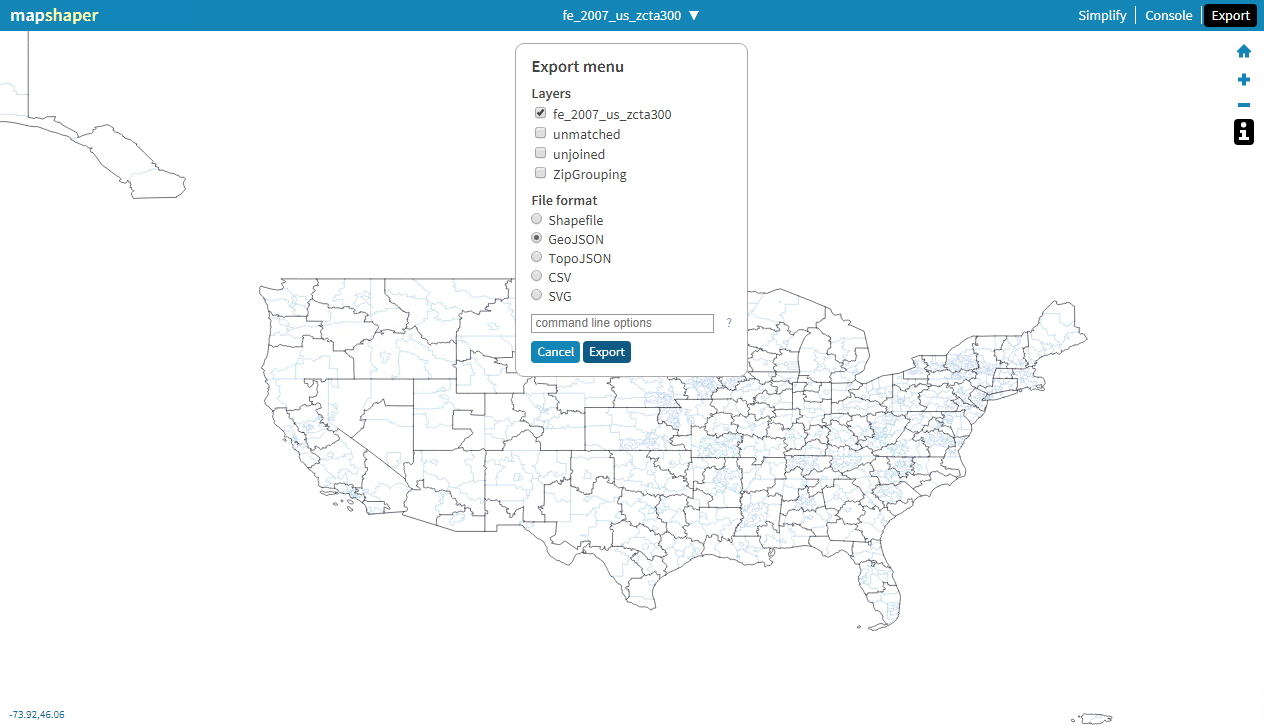
Once you're happy with the simplifications (clicking "Repair" if there are line intersections detected), click "Export" in the top right corner. Uncheck the other layers, change file format to "GeoJSON", and click the "Export" button.
Import into MapBox
Now you have a file that is ready to import into MapBox! Go to https://www.mapbox.com/studio/tilesets/ (signing in to your account, if needed), and click the "New tileset" button.
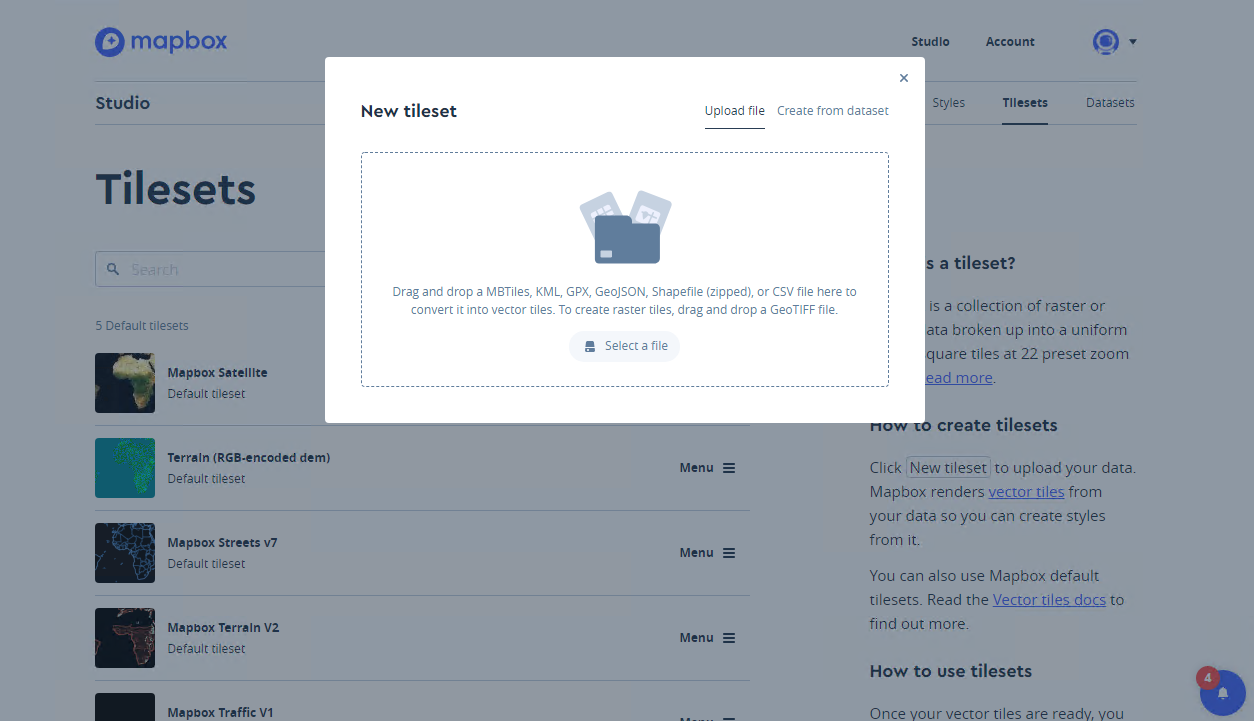
Choose the GeoJSON file you just saved out of MapShaper, or drag it onto the dialogue box and click the "Confirm" button. MapBox will take a minute or two to import and process the file.

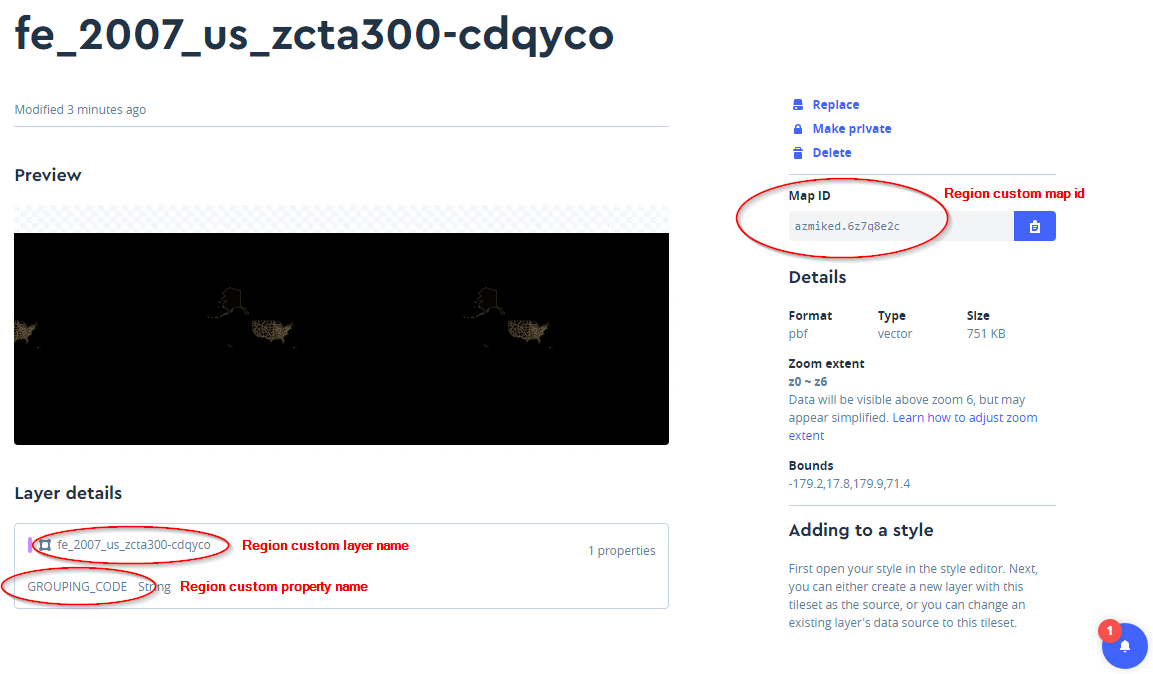
Once the upload and processing is complete, you'll be able to click on it. All the information Cognos needs is on this screen, as indicated below:
APRIL 2020 UPDATE
MapBox no longer uses the “Map ID” terminology. Instead, your Tileset is now aptly identified by a “Tileset ID”. Unfortunately, it seems that there may be an issue in Cognos prior to 11.1.6 using the Tileset ID on newly created Tilesets in place of the Map ID. A couple readers brought this to my attention, and in my own testing I was able to utilize old tilesets, but could not get newly created ones to work in Cognos 11.1.5. However, in 11.1.6 this issue appears be resolved (though the terminology in Cognos is still “Map ID”).
It should also be noted that MapBox now makes Tilesets private by default, so you’ll need to toggle to public before Cognos will be able to access it.
Use your Boundaries in Cognos
Create a new Cognos report with a map visualization. On the region layer, you should drag on a field that matches GROUPING_CODE from your grouping CSV file (the one you dissolved to in MapShaper), and drag in whatever measure you like under "Color". Then populate the "Regions” section of the map visualization properties with the values from MapBox as shown below.
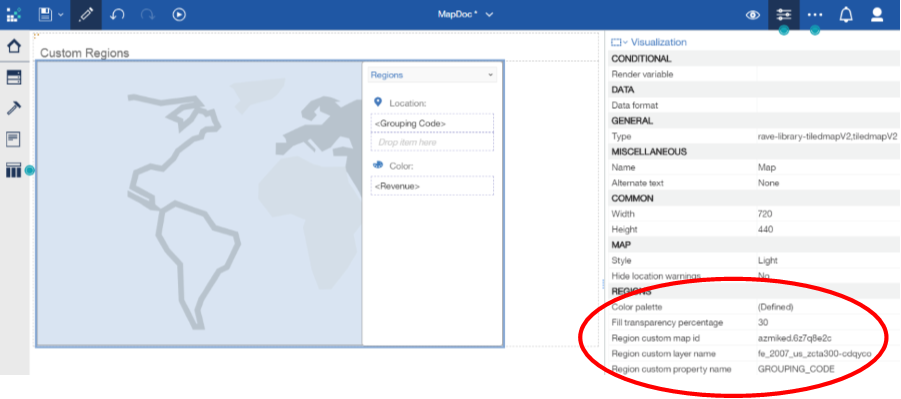
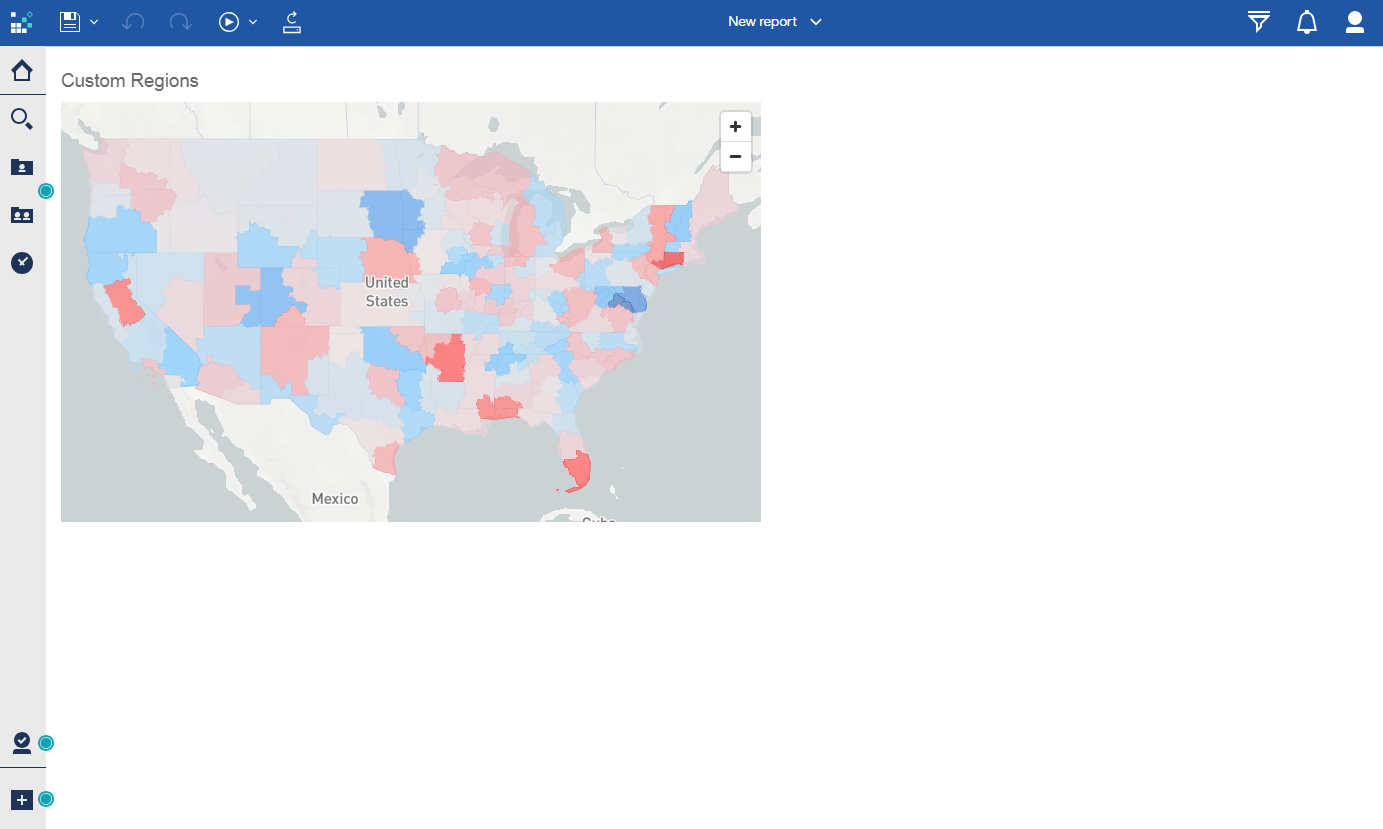
Adjust your color pallet and fill transparency as desired, and view your finished product!
Bonus Stuff
Additional useful MapShaper commands
1. Create a new field based on existing field. For instance, you could create 3 digit zip code from a 5 digit one.
-each ZIP3=ZIP.substr(0,3)2. Merge multiple layers. For instance, you can download a shapefile of Canada and merge it with the US one to create a North American map.
-merge-layers target=layer1,layer23. Generate a "points" layer. This will create a point at the center of each polygon (and remove the polygons). This file can be saved off as a separate GeoJSON, uploaded to MapBox as a separate Tileset, and configured under the “Points” section of a Cognos map visualization.
-points centroidReader Comments
Josh wrote in that he found that rather than install Node.js and Mapshaper locally, he could go straight to https://mapshaper.org/ and upload his zip code file and CSV file. He initially ran into file size limits with Chrome and IE, but eventually figured out that Mozilla Firefox worked just fine. I can’t totally remember as I figured out this process awhile back, but I think I might have run into the same issue as Josh—which is what led me to install locally. Kudos to him for figuring out a way to get mapshaper.org to work!
Conclusion
While there are a number of steps and a few different tools involved, the process is not overly complicated and the result is a powerful new type of map tailored to your business!
Next Steps
We hope you found this article informative. Be sure to subscribe to our newsletter for data and analytics news, updates, and insights delivered directly to your inbox.
If you have any questions or would like PMsquare to provide guidance and support for your analytics solution, contact us today.
