Crosstabs: Beyond the Basics

Abstract
This article will introduce some intermediate to advanced level techniques for developing Crosstabs in Cognos Analytics
Assumptions:
User has Access / Capabilities to the report editor in Cognos Analytics
User has Access to / knowledge of a data source for authoring… relational or dimensional
User has basic knowledge of authoring in Cognos Analytics reporting already and may have some familiarity with crosstab development
Introduction
While the most basic reports in Cognos Analytics will use Lists, Crosstabs will allow more advanced/complex report development and layouts. The goal of this article is to help the reader gain a better understanding of working with crosstabs and expose some features and capabilities that newer users may not be aware of.
Crosstabs are very similar to the Pivot tables in Excel and operated based on intersections, known as tuples, of descriptive (dimensional) data while aggregating 1 or more measurable facts.
A very simple example is shown below:

Design View:

A crosstab consists of:
Rows
Columns
Fact cells (values)
Unlike a List, the columns are based on data item results… if there was data for 12 months in “Month Name”, we’d see 12 columns. This is only available with Crosstabs, where lists’ columns are static.
Data is aggregated and returned based on the intersection of rows and columns, based on the selected measure, in this example, Sales. So… Sales of Food for April 2019 = $28,585.85
Intermediate Crosstabs
Let’s move on to some more intermediate topics about Crosstabs.
A simple crosstab, such as the example above, might use a single measure… in that case Sales. However, crosstabs can handle multiple measures, but using them as inner nested columns (or row) in a more complex crosstab layout.
Here, I have added both the Sales and Quantity measures as Inner nested columns, so that the report will now show both, rather than just Sales:

The crosstab corner, displays “Sales” because the crosstab’s Default Measure property is set to Sales… since we now have 2 measures in the columns, we could clear the default measure property by clicking on the 3 dots to select the crosstab object, then go to properties window on the right, find Default Measure property and change to (default):

Finally, we can add a calculation to compute the Sales/Unit by dividing the Sales by Quantity. Select the 2 cells (ctrl + click) and click the Insert calculation toolbar button.
A dialog will popup. Select the desired calculation or create a custom calculation. In our example, I have selected Sales/Quantity:

And here is the result. Notice even though I selected April’s Sales and Quantity cells, it also created the calculation for the other months:

I don’t like the column heading it gave me so let’s change it.
I set Text Source type to Data item label, and update the calculated data item Sales/Quantity’s label to be Unit Price:

Finally, I want this column to have 2 decimals only, so we need to set the Data Format. While you can select each and every individual cell that requires this using ctrl_click, the more efficient way is to select member fact cells, available on the three dots in the toolbar. Select the cell, click the more button, then Select member fact cells:

You will now see that grouping of cells all selected and you can apply your desired data format in one place:

When formatting, it’s important to understand the object hierarchy. For crosstabs, the individual cells are the lowest level with row and column fact cells higher and finally all fact cells at the top. So, you can format all Fact Cells once and then if necessary, format certain columns or rows, or even individual cells differently. The lower format will “win.”
Here I am applying a 0 decimal number format to all fact cells. Like before, click More and then Select Fact Cells, set format.

Notice the Unit Price cells still show the 2 decimals, since that is set at a lower level.

I don’t like the empty cells, so I will show you how a value can be displayed there.
By Default, the crosstab fact cells will show the Cell Value. This can be changed, however, to a data item, a report expression or text.

For our example, the empty cells mean there is no data, or the value is Missing, or null. I will change the Crosstab fact cells from Cell Value to a Report expression that will check for this and return a 0 if found, otherwise just return the Cell Value.
The expression will utilize a function called status(expression) to check if missing/null.
In the else, we also have to convert the CellValue() to a string and then to a double to satisfy Cognos’ pickiness … don’t get me started on this one.
If (status(CellValue()) = 1) then (0.0) else (string2double(number2string(CellValue())))

You might ask… why use this expression rather than just applying Missing Value data format? Good question! Those data formats (Missing, Divide by Zero, etc.) come across as text when output to Excel, and for that reason, I prefer using something that keeps all the cells numeric.
Another property of the Crosstab object that sometimes goes unnoticed is the suppression property. By default, there is no suppression set, but if desired, this property can be changed to Rows, Columns or Rows and Columns depending on the requirements. The rule is if all fact/measure data is missing or 0 (setting in suppression property) to suppress. This property is found under the DATA section when the crosstab object is selected.

As you can see there are many combinations of suppression that can be applied to the crosstab:

Quite often, depending on the data source, if there is no data for a dimensional element, the suppression may occur naturally based on the type of source.
On to some more advanced techniques and features available in crosstabs.
In certain cases, the cell value at a specific intersection may not be the desired value required for that cell. For example, in a P&L report, we may want to flip the sign of variance values for Expense/Cost of Goods Sold accounts, where the natural sign is fine for Revenue and Profit accounts.

So here we want to show Product cost as a negative value but leave Revenue and Gross Profit as-is.
So, we select the Product cost row edge node, then select its member fact cells:

Then we flip the Define contents to True/Yes:

Notice the data is gone. Now we need to add a custom report expression inside these cells.
In order to do this, we first need to “unlock page objects” which allows access to the crosstab cells themselves. To unlock, click the lock button in the right-side of the toolbar, so that the lock now looks like it is Unlocked:

From the insertable objects on the left side of the window, drag a Layout Calculation into either one of the cells that is now blank, in the Product cost row.
Enter the expression: CellValue() * -1 and click OK.
You should now see this in Page Design mode:

Or this in Page Preview Mode:

Note the Product cost values are now negative, as desired.
The Define contents property can be applied to member fact cell groups, or individual cells alike. In more complex cases, you may need the expression to reference a data item that isn’t in the crosstab layout. In these cases, use the crosstab node Properties setting to include data items necessary. This is common in multi-dimensional report authoring where you may include a data item that returns what level of a hierarchy the current member is from, etc.
OK, the last advanced topic I will cover in this article is using Nesting in Rows and columns (my example will be rows). Nesting can really open a report up to answer more questions the business might have… like which Retailer had the most revenue and what type of retailer are they? To do this I would suggest nesting dimensions.
Here I have added Retailer left of my facts, and Retailer type to the left it Retailer. This is “Nesting.”
I have clicked on Retailer and then the Filter toolbar button and selected edit Layout sorting (I will explain the fuscia color later) so that I will see the Retailer with the highest revenue first and then proceed downward:

The Fuscia coloring is my personal way of telling me and future developers tasked with maintaining the report, that this node is set to not show, using Box type = None.

You must enable Show Hidden Objects in your Visual Aids in order to see objects with Box Type = None!

I am hiding the Retailer Type as I want to show this value in the Retailer cell, within parenthesis.
So, I click on the Retailer node in the row, then alter the Text property to use a Report Expression.
Then I enter the expression: [Retailer]+ ' (' + [Retailer type] + ')'

When I run the report, I notice all the Department Stores are listed first even though there are 2 Outdoor Shops that should be in the top 5… this is because the outer-most row edge is still “grouping” the Retailers, even though it isn’t visible.

We need to correct this, which means changing how we get the Retailer type into the Retailer node which is visible.
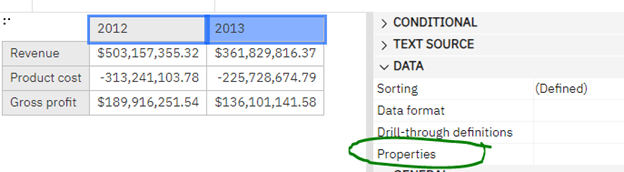
Before we delete the Retailer type row edge node, we first need to add Retailer type to the Retailer’s properties:

Now we can safely delete the Retailer type row edge node and run again.
We now see the true descending sort on Revenue (it’s the combined total between the 2 years), regardless of the retailer type, but we still see it in our output, and the 2 Outdoor shops are now showing in the top 5:

Conclusion
I hope these intermediate and advanced techniques help take working with Crosstabs to the next level for you. The 2 report definitions are attached to this article and require the following data sources:
Part I: Coffee Sales and Marketing data module (samples)
Part II: Sporting goods company package (samples)
Next Steps
If you need either of these sample data sources, please contact PMsquare support. Lastly, if you would like to hear about more advanced Crosstab techniques, please let us know!
