Getting Started: Authoring Your First Cognos Analytics Report

Abstract
A guided start for a new user authoring in IBM Cognos Analytics reporting for the first time.
Assumptions:
There is already a published package or Data Module available to the user in the environment
The user has nominal knowledge, understanding of the contents of the package/module
The user knows how to log in to Cognos Analytics
The user has the capabilities assignments necessary in Cognos Analytics to use report authoring
The user knows the name and location of the package or data module that is available for them to author with
Introduction
So, you have been granted access to your company’s Cognos Analytics application, and you are eager to create your first report, but not really sure where to start, or how to get to the point that your report is answering the questions you are hoping to answer. Hopefully, this article will help you achieve your desired results, or at least get you a good start towards that goal. Let’s get started!
Authoring a new list report
Step 1
Open your browser (Chrome is preferred) and navigate to the Cognos Analytics environment, and log in.
Step 2
Locate the + New link, usually in the lower left-hand portion of your Cognos Analytics portal, click it… then select Report.
Step 3
You will be presented with a dialog to choose a template and theme. For now, just click Blank and then click OK. You will now be on the report authoring screen.
Step 4
To be able to author, you need a data source, so click the Select a source button, and navigate to the location that houses the page or data module that you want to use, select it and click Open (for this document I am using a very tried and tested GO Sales (query) package included with the Cognos Analytics samples).
Step 5
The data source will be added to the report and its metadata (structure) will be retrieved. You are now ready to begin authoring!
Step 6
Below the navigation bar, locate a selection box towards the right hand side of the screen, and select Preview mode. This will run the report with every addition/change to the report.

Step 7
In the center of the screen, you will see a circled + icon… this is a quick way to add the most popular containers for your report, such as lists, crosstabs, visualizations. For this document, we are going to author a simple list, which is arguably the most common data container in business analytics reporting. Click the circled + icon and select List… then optionally name the list container object and the query (when you are creating more complex reports with many containers and queries, will become important to name these for future identification).

Step 8
A list is now placed on your report. You will need to insert columns into the list from your data source, so on the left-hand side of the screen, expand your data source until you find the items you wish to include in the list.

Step 9
Drag any number of data items onto your list to create columns. Depending on the aggregation type associated with each data item, along with the authoring settings, the report will react differently (to select multiple data items, use Ctrl + <mouse left click>).
Here I have dragged in Product line and Product type from the Products query subject (table) and the quantity from the Sales table, essentially giving me the quantity sold of all unique product types.

Step 10
In this case the data is somewhat unorganized, so we can perform a couple simple operations to group and sort the data, so it makes more sense.
a) Let’s group Product line and type… Ctrl + left-click on the headers for each, the click the Group icon in the toolbar… the list is now grouped and subtotals added.

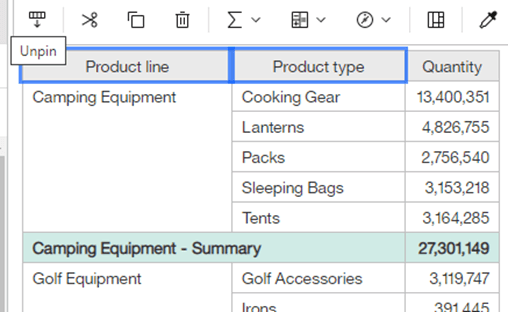
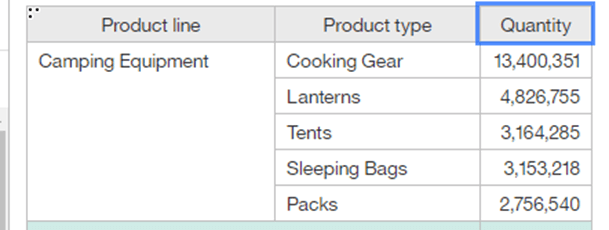
b) Finally, we want the Product types to be listed in greatest quantity to least, within each Product line, so we’ll add a sort on quantity… now the types in sorted as desired

Step 11
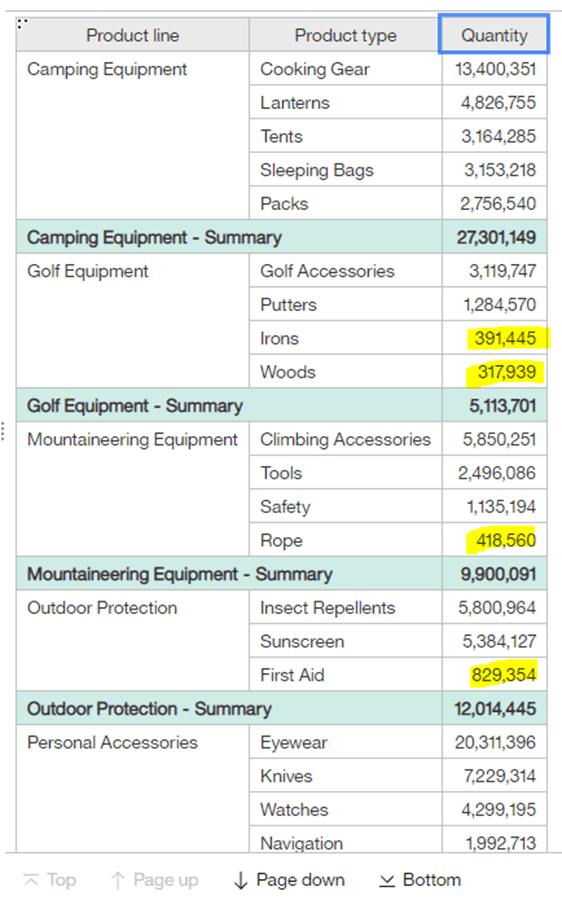
Lastly, we want to only show Product types that have a quantity greater than, or equal to 1,000,000, so we’ll add a filter.
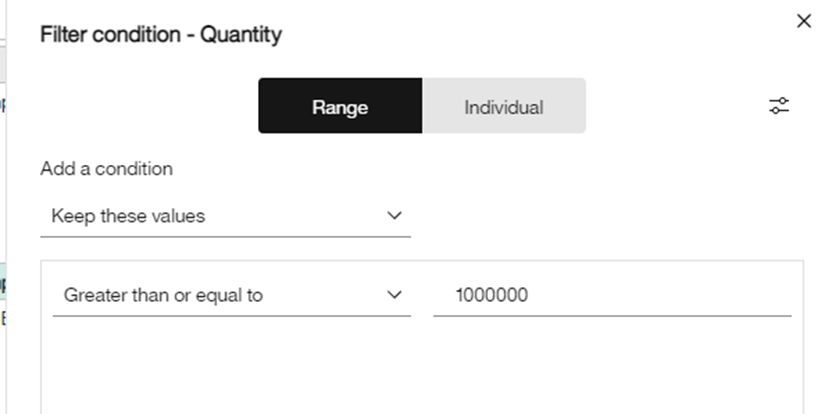
a) We want to filter on Quantity, so click the quantity column header, then click the filter icon in the toolbar, and select create custom filter.

b) Select Greater than or Equal to, and enter 1000000 in the slot to the right.
Before the filter (want to remove the highlighted rows)
After the Filter

Conclusion
This rather simple example may not reflect your desired layout, or satisfy your requirement, but it is meant to give a solid jumpstart to getting your report authoring experienced started. Everything done here is probably applicable to 98% of reports you will author. Of course, there are many other ways to further breakdown and organize the data, and getting in to the authoring application and navigating around the tool, you will soon discover other ways you can highlight data situations and identify important scenarios for your business. Experimenting with and using the various functionalities available within reporting will be the best way to gain more confidence in how you can leverage the power of Cognos Analytics reporting. In future articles, we will take a look at more of the basics and begin delving into more intermediate topics of authoring.
Next Steps
We hope you found this article informative. Be sure to subscribe to our newsletter for data and analytics news, updates, and insights delivered directly to your inbox.
If you have any questions or would like PMsquare to provide guidance and support for your analytics solution, contact us today.
