

Share


Chris Chapman, November 9, 2026
Get the Best AI Solution
for Your Business Today!
Summary
Claude Dashboards let users query enterprise data and build live dashboards inside Claude, and they’re designed to work alongside existing BI tools. This article breaks down how a Claude Dashboard is built, how it stores data and traces every number back to its source, how to convert one into a Power BI project with a Claude skill, and how enterprises can use it for governed self-service reporting on platforms like IBM Cognos.
Table of Contents
What are Claude Dashboards?
Anthropic recently announced an overhaul of Artifacts within Claude. One enhancement that specifically caught the attention of many was the addition of Dashboards, which allows users to query enterprise data and build live dashboards.
This means BI tools are dead, right? Not exactly. Anthropic built Dashboards to work alongside existing BI tools, and the announcement describes two kinds of integration that are easy to blur together.
The first is where data comes from. Anthropic’s examples are data platforms like Amazon Redshift, BigQuery, ClickHouse, Databricks and Snowflake, plus CRMs like Salesforce. The second is where a dashboard goes next. When a question needs deeper analysis, you can send the dashboard to Amplitude, Grafana, Hex, Mixpanel, Omni, Perplexity, PostHog or Sigma, with Databricks Genie, Looker, monday.com and Tableau coming soon.
Neither list limits what Claude can query. Under the hood, a live data source in a dashboard is just a connector, a tool on that connector, and the query to run (more on that below). Any system you can reach through an MCP connector, off the shelf or custom built, can feed a dashboard. At PMsquare we’re leveraging our decades of experience delivering trusted data solutions to build connectors that connect Claude Dashboards seamlessly to various data warehouse and enterprise analytics platforms.
Dashboards Artifact Deep-Dive
So how does this work? Is this a real BI dashboard, or is this just AI smoke and mirrors? In short, it’s a real dashboard. The general underlying structure will be familiar to seasoned BI developers.
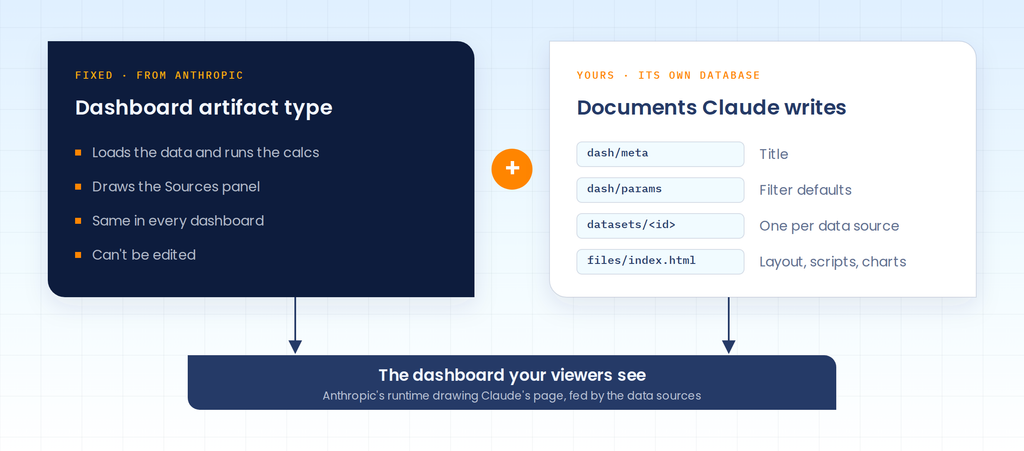
A Claude dashboard is built in three layers. At the bottom is a fixed program from Anthropic called the Dashboard artifact type. It’s identical in every dashboard and you can’t edit it. It does the heavy lifting of loading data, running calculations and drawing the Sources panel. On top of that sits a small database that belongs to the dashboard itself. It holds a handful of documents: the title, any filter defaults, one document per data source, and the HTML page Claude wrote with the layout and charts. The third layer is the data, which is either queried live or attached as a file. If you’ve worked in Cognos, the type is a lot like the report server, and that database is the report spec. Basically, what you see on screen is Anthropic’s runtime drawing Claude’s page, fed by the data sources.
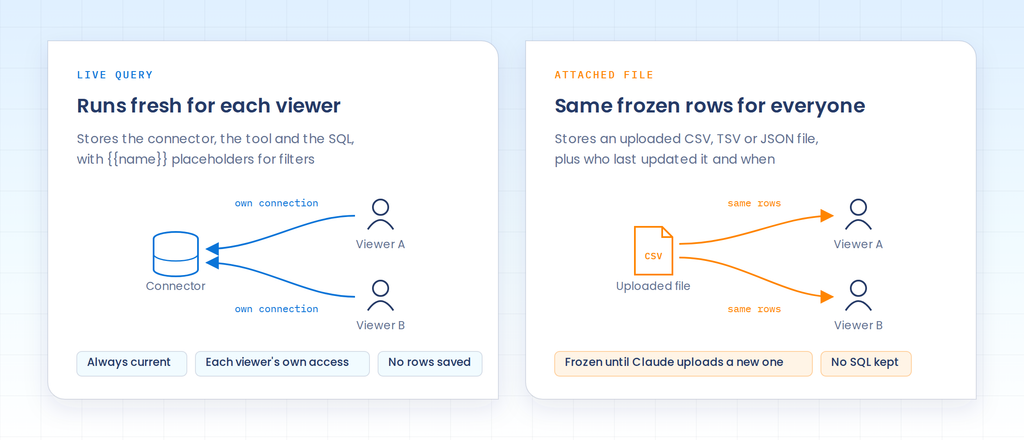
Each data source is stored as one of two kinds. A live query stores the connector and tool to call plus the SQL, with {{name}} placeholders where filters go. No rows are saved in the dashboard. Each viewer’s browser runs the query on that viewer’s own connection, so the numbers are always current and nobody sees data their access doesn’t allow. An attached file works the other way around. It’s an uploaded CSV, TSV or JSON file, everyone sees the same frozen rows until you upload a new version, and no SQL is kept with it.
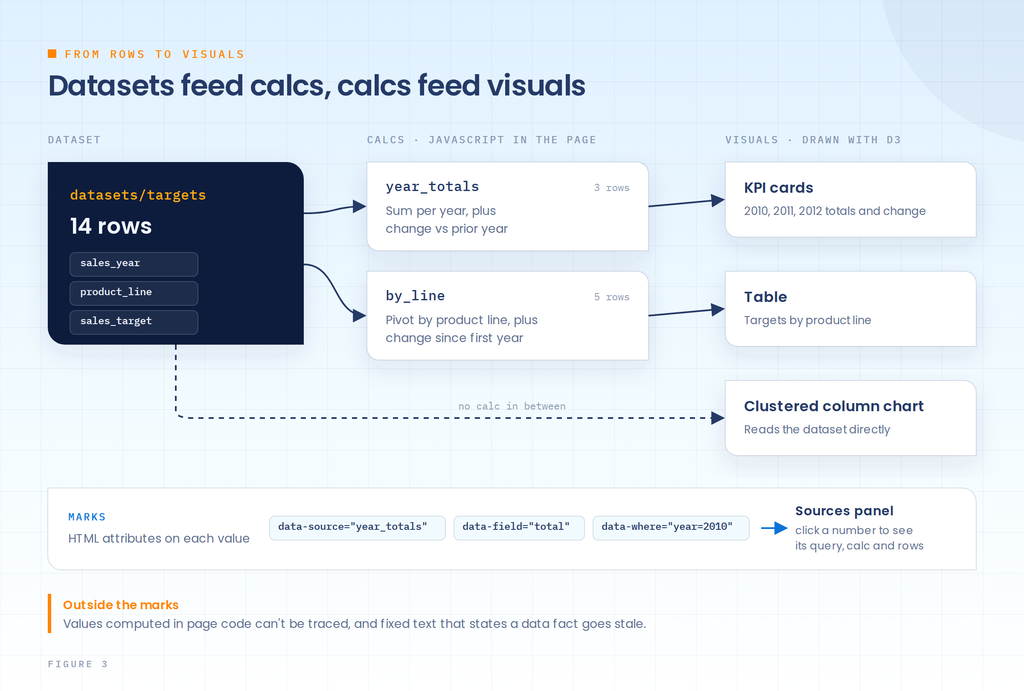
Between the data and the visuals sit calcs. These are small JavaScript functions in the page that turn dataset rows into new rows, like totals by year or a pivot by product line. Anthropic’s own guidance is to do that math in SQL when everything comes from one connector, and to save calcs for sources that can’t share a query, which is how most of us would want it anyway. The visuals are drawn with d3 in the page’s scripts. So where’s the chart type defined? It isn’t. A clustered column chart exists only as two nested band scales in the drawing code, and that surprised me more than anything else in here. What ties a number on screen back to its source is a set of HTML attributes called marks. data-source names the dataset or calc, data-field the column, and data-where or data-row-key the row. Click a marked number and the Sources panel shows its query, the calc and the rows behind it. That’s lineage down to a single value, and it’s the part of the design I like most. The gaps are anything outside the marks. A growth percentage computed in page code without a mark can’t be traced. A sentence like “Mountaineering Equipment has no 2010 target” is plain text, so it goes stale the moment the data changes. Those are the two things I’d check before sharing a dashboard.
How do you use a Claude Dashboard in Power BI?
So we know what a Claude Dashboard is and how it works, but how do we leverage one in Power BI if there isn’t a dedicated integration yet? There are a couple of options, but the simplest is to build a skill that allows Claude to convert its native dashboard into a PBIP file that can be opened in Power BI Desktop. This will package the database connection, queries and visualizations into a single project that can be directly opened in Power BI. This is exactly what I did as a starting point to prove more complicated integrations can work. I crafted a skill that deconstructed the Claude dashboard and rebuilt it as a PBIP project.
To test the full workflow I prompted Claude with, “What were the sales targets from 2010-2012 by product category?” Opus 5.5 on medium effort produced the below dashboard.
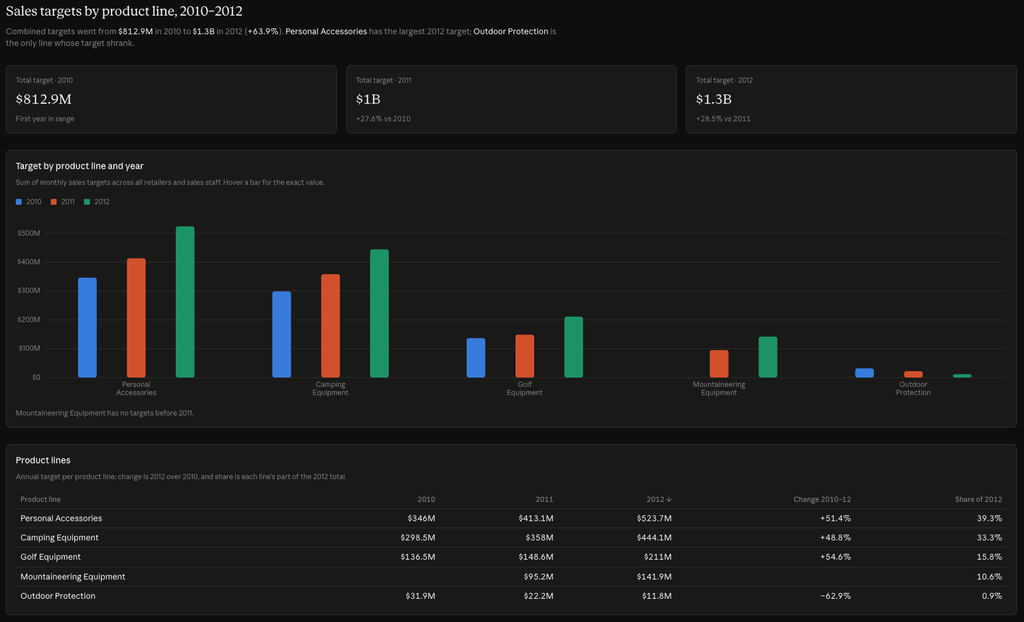
Pretty good results! I then ran my dashboard export skill against this artifact. A few minutes later, Claude produced a zip archive containing the PBIP files.
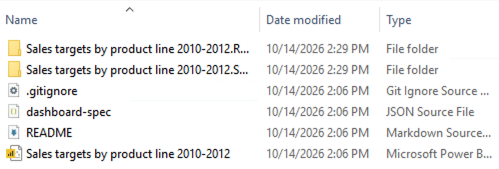
The skill produced a very close replica of the Claude dashboard. There are things that need to be tweaked and fine-tuned. But the majority of the work is done and the dashboard is very close to being able to be shared.
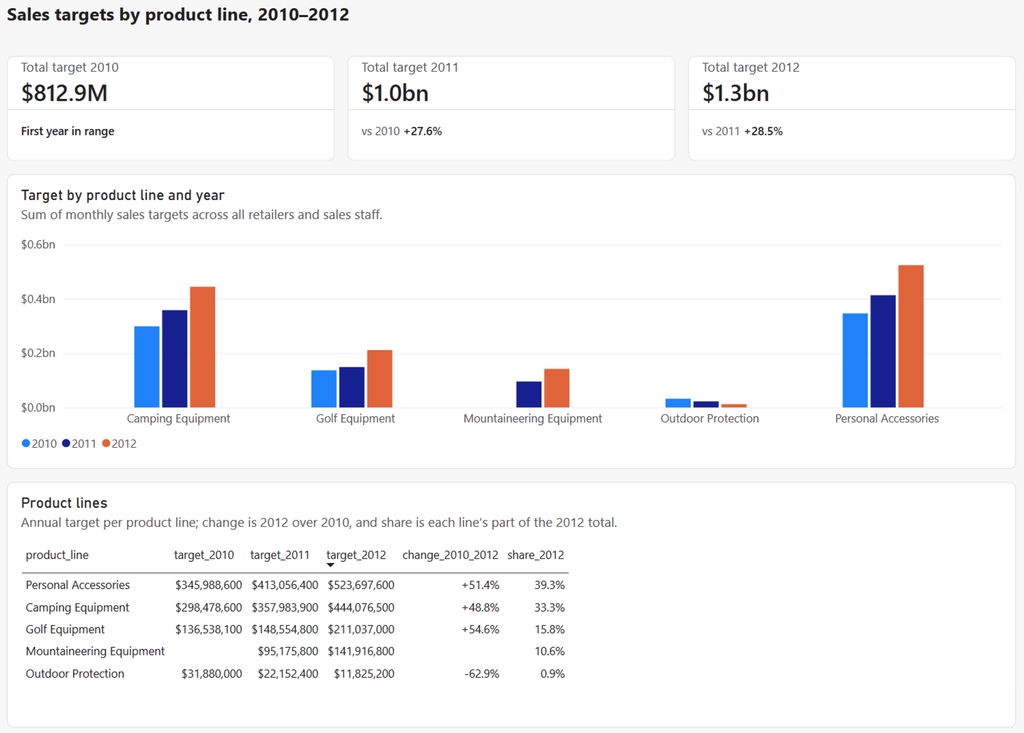
If the export/import dance is too much for you to juggle you can deploy an MCP server to directly connect to your Power BI tenant. This would allow a more seamless integration. This route will require more initial set up and configuration.
How should enterprises think about Claude Dashboards?
It’s neat this all works together, but how should enterprises think about Claude Dashboards in relationship to their BI initiatives? We believe that this should be thought of as the next evolution—and perhaps ultimate realization—of self-service reporting. For decades, BI and IT teams have been trying to empower users to build their own reports and dashboards with limited success. Ticket queues are still full of requests for new content development. Claude can now enable users to actually achieve their self-service objectives in a real way.
Most enterprises have spent years building governed models, certified reports and security rules in platforms like IBM Cognos Analytics, Planning Analytics or Power BI. That’s the most trusted data in the building, and Claude can work with it directly instead of rebuilding that logic from raw tables.
We built a Cognos connector to prove this out. Claude Dashboards built on top of it query Cognos live, pull data from existing packages or reports, enforce each viewer’s Cognos security, and can save work back into Cognos. It also tackles the oldest problem in self-service: before building anything, it checks whether a report that answers the question already exists, and it can reuse pieces of existing reports in new dashboards. That’s self-service without the sprawl, and truly accessible to anyone who needs it.
A more powerful self-service tool does not mean report developers are no longer needed. Just like its sibling product Claude Code, the more skilled you are in the domains of data analytics and BI development, the more you can get out of the tool. An end user might be able to make a quick dashboard, but a veteran BI developer will be able to produce more engaging and useful content in a much shorter time than they would be able to on their own.
Claude Skills are a critical tool for helping to rein in end users. If there are certain guidelines your organization follows for visualization, themes, data structures, etc., these rules should be built into skills that are shared enterprise-wide. This will help ensure anyone vibe coding a dashboard will still be following those standards even if they’ve never heard of them.
Where PMsquare Fits
None of this has to be complicated. These tools can be a powerful accelerant for the work you are already trying to complete. If you or your organization are needing help navigating these new capabilities, or building MCP connectors for your systems, reach out to us at PMsquare. We would be excited to help you find the right way to empower your teams with these new capabilities.
Questions from our Clients
Yes, with a conversion step. A Claude skill can rebuild a Claude Dashboard as a PBIP project that opens in Power BI Desktop, with the connection, queries and visuals included. Expect a close replica that needs some fine-tuning before you share it.
It depends on the data source. A live query runs on each viewer’s own connection, so the numbers are current and respect that viewer’s access. An attached CSV, TSV or JSON file shows everyone the same frozen rows until someone uploads a new version.
Yes, through an MCP connector. PMsquare built a Cognos connector that lets Claude Dashboards query Cognos live, pull from existing packages or reports, enforce each viewer’s Cognos security and save work back into Cognos.
Yes, as long as the number is marked. Click a marked number and the Sources panel shows its query, the calc and the rows behind it. Values computed in page code without a mark, and numbers written into plain text, can’t be traced, so check those before sharing.
No. An end user can build a quick dashboard on their own. An experienced BI developer will still get more engaging and useful results, and in far less time than building the same thing by hand.
Be sure to subscribe to our newsletter for more PMsquare updates and insights delivered straight to your inbox.