

Share


Mark Karas, February 10, 2025
Get the Best Solution for
Your Business Today!
Getting Started in Multi-Dimensional Report Authoring
In this article, you will be introduced to the basics needed to begin authoring a report using a dimensional data source. Dimensional data sources include, but are not limited to:
- IBM/Cognos
- Planning Analytics cubes
- TM1 cubes
- Transformer cubes
- Dynamic cubes
- DMR (Dimensionally Modeled Relational)
- Other cubes
- SAP BW
- Microsoft SSAS
Historically, most people that get started developing reports in Cognos Analytics do so using a relational data source, such as from SQL Server, Oracle or other relational database management system (RDBMS). The techniques used in relational report development are somewhat different than the techniques used in dimensional report authoring. We will look at these differences shortly, but first let’s take a look at some of the main components/principles of a dimensional data source and define what they are so that once we start discussing authoring techniques, the terms used will make sense.
Table of Contents
Understanding Dimensional Principles
What is a Dimension? Descriptive information, like a month, a color, a name, a place.
What is a Fact? Measurable information, like revenue or quantity, or a count of people or occurrences.
Doing a deeper dive into the concept of a Dimension, we will use the Time dimension as an example/reference.
- Dimension contains 1 or more HIERARCHIES. Hierarchy can be described as a logical organization of a multilevel dimension, that allows a natural rollup of information from lower to higher levels. A typical Time dimension will have a default Time by Quarter hierarchy of Year -> Quarter -> Month -> Date. If necessary, an alternate hierarchy, Time by Week might be defined, as Year -> Week -> Date. And, as necessary, even more hierarchies can be defined.
- Hierarchy contains 1 or more LEVELS. A level can be described as a place in the logical organization of certain dimension’s detail. So, in the default hierarchy of the Time dimension, there are 4 levels, Year, Quarter, Month and Date.
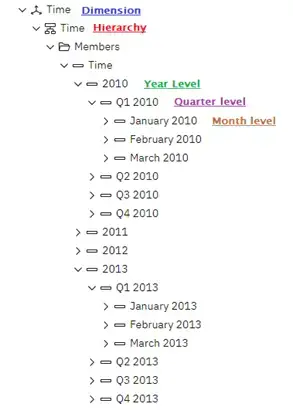
- Levels are where MEMBERS are defined. Members are the values that exist at a given level within the hierarchy and is where the actual data comes into play. So, the members of the Year level in the Time dimension would be 2015, 2016, 2017, 2018… and the Month members would be Jan 2017, Feb 2017, Mar 2017, etc… Note that the Month members include the year… this is a typical ancestral relationship of a hierarchy… members at lower levels are descendants of the higher-level members, and vice versa… members at Higher Levels are ascendants of the lower level members. The year 2017 member has children members Q1/2017, Q2/2017, Q3/2017 and Q4/2017 at the Quarter level, and grand-children members Jan 2017, Feb 2017, etc… at the Month level. Below is the member view of the Time dimension from the GO sales (analysis) package’s Sales (analysis) namespace:
- Within a Level, there are some important properties defined to ensure the level functions as desired and provides the necessary information and value… these include:
- Business Key – This defines how members are differentiated from one another, a unique identifier. So, for a given date member in the Date level, the business key might be an integer: 20170417 (yyyymmdd)
- Caption – This is the default value that will be seen in the reports to represent the members at a given level. For example, for a date level the caption might be of the long variety: April 17, 2017… this is what will be seen on the reports when members from the Date level are returned.
- Level sorting – This defines how the members of a level are to be ordered by default. Jan is actually after Feb in an alpha-numeric sort… so to ensure Jan shows before Feb, we would sort the Month level on the month number, for example.
- Attributes – Any other piece of information that is pertinent to a level and necessary for reporting, can be included as an attribute. An example of this at the Date level is, Day of the Week… so the member 20170417 would have a Date level Day of the Week attribute of ‘Monday’.
- Other basic building blocks of Dimensional Authoring that are vital to understand
- MUN – Member Unique Name. This is the fully qualified address to a given member of the cube, and each MUN is unique.
- Tuple – the concept of a tuple is simply an intersection of 1 or more members in a dimensional data source, such as a Cube or DMR. For example, the intersection of the Revenue member (fact) and the Year 2017 member (Dimension) is a tuple. The meaning of tuple will become clearer later.
- Set – the concept of a set is simply a grouping…. or Set, of 1 or more members from a single hierarchy. Understanding when you are working with a set versus a member is another basic piece to the dimensional authoring puzzle that needs to be understood to succeed.
Setting Ground-Rules for Authoring with a Dimensional Data source
- Typically, Detail filters are not used when authoring dimensionally. Filtering in dimensional authoring is done via the filter() function, or using slicers (context filters). There may be some extenuating circumstances that require a detail filter, but these cases are very rare.
- Knowing any requirements from your cube data source is compulsory… for example if a certain dimension is a requirement, you may struggle to see data if you don’t comply with the requirement. This is more common in TM1/Planning Analytics cubes.
- To get the full use out of the dimensional data source, Crosstabs will be the best choice for data that is required to be shown in a table format. Lists can be used, but their capabilities are better suited for use with relational data sources. Similar to crosstabs, charts and visualizations are also very useful with a dimensional data source.
- If drilling down/up is a requirement the dimensional report to be authored, this may affect some of the techniques/implementation to be used. Drilling down/up is only available (natively) when using a dimensional data source (or a data module with “Navigation paths” defined, which is out-of-scope for this article).
Authoring a Simple Dimensional Report
Assumptions:
- The author has a basic or higher experience and understanding of using Reporting (aka Report studio)
- The author has access to the Cognos Analytics samples, including the GO Sales (analysis) data source
Create a new report:
- Open Reporting to author a new report.
- Select a layout template (blank is fine).
- Choose the GO sales (analysis) package for the data source.
- Add a crosstab to the page (name the crosstab and/or query as you desire).
- Put the report in Page preview mode.
- At this point, the report can be authored a few different ways.
- Simple drag from the data source, letting Cognos control how the query and its data items are defined. This will offer less capability to modify later.
- Full control by the developer, using custom defined data items.
- Somewhere in-between these 2 options.
- All of these options have their advantages and disadvantages, so I hope to demonstrate the multiple options at some point.
- For this example, given this article is positioned for authors new to dimensional authoring, I will use the simple drag and drop method (first option).
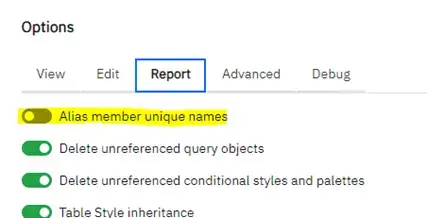
- Set the options for the Report, so Alias member unique names is off.
- We want Years in the columns, Product lines in the rows and Revenue in the fact cells (measure). There are multiple ways to do this, so I will cover these options.
- Years:
- Drag a new Query calculation into the columns node of the crosstab.
- Select other expression.
- In the expression editor, type “children()” and then drag the top member “Time” from the Time dimension between the parenthesis. The expression should look something like this:
children([Sales (analysis)].[Time].[Time].[Time]->[Time]) - Name the data item “Years”, click OK. You will see the years in the columns (children of top member, Time)
- Product lines:
- Drag a new Query calculation into the columns node of the crosstab.
- Select other expression.
- In the expression editor, type “children()” and then drag the top member “Products” from the Products dimension between the parenthesis. The expression should look something like this:
children([Sales (analysis)].[Products].[Products].[Products]->[Products]) - Name the data item “Product lines”
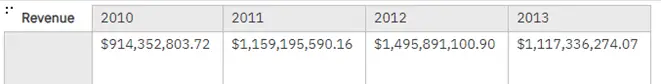
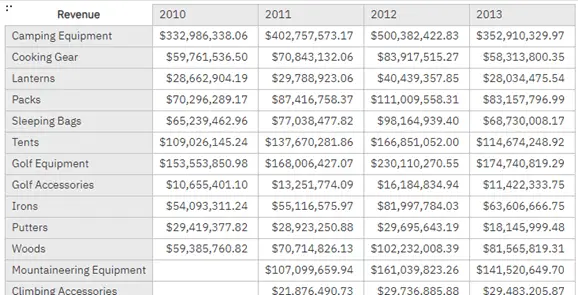
- Drag Revenue from the Sales measure dimension into the crosstab fact cells. Your crosstab should look like this in Preview mode:
- Both the columns and the rows utilize the children() function which, as its name indicates, returns the children of the selected member. It was decided that we want to see Product lines and types in the rows, so we’ll need to alter the expression of the “Product lines” data item.
- To get multiple levels of a member, or a set, we will change to use the descendants() function, and specify 2 levels of descendants (1 Product line, 2 Product type), and to show the members before. The expression should now look like this:
descendants([Sales (analysis)].[Products].[Products].[Products]->[Products],2,self before)
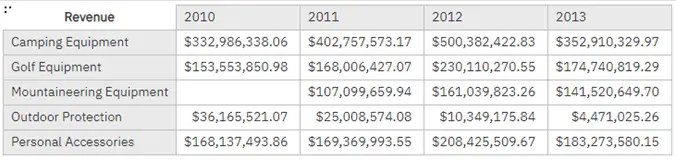
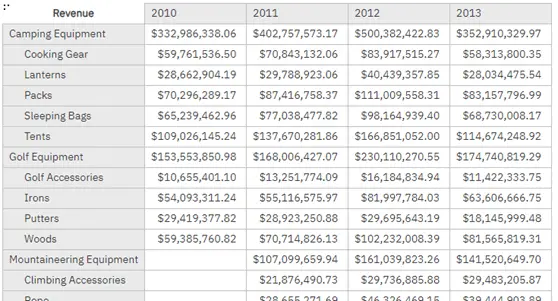
- Rename the data item to “Product lines/types.” Here is what the report will look like now:
- Note that the Product line and types are clumped together… we expect this, but we can set the indentation to vary by level
- Click on the row edge
- In the Properties pane, locate the Level Indentation property, click to alter
- Select “Based on the Level of the Hierarchy” and set to start after level 1, since we aren’t showing
- Select “Based on the Level of the Hierarchy” and set to start after level 1, since we aren’t showing the Top level, so we don’t need to indent the Product line rows
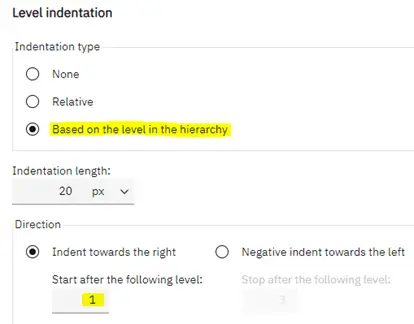
- …click OK, so we now see the Product types indented
Conclusion
We hope you found this article to be interesting and insightful. If you have any questions, or would like PMsquare to provide guidance and support for your Cognos Analytics solution, contact us today! Be sure to keep an eye out for Part II.
To stay ahead with the latest updates and best practices, be sure to subscribe to our newsletter for expert insights delivered directly to your inbox.
Published Date: