
Mark Karas, January 6, 2025
Get the Best Solution for
Your Business Today!
This article will cover one of the newer features in Cognos Analytics Reporting, the Data Table. This new type of data container was incorporated into the product in 2022’s release, 11.1.6.
Assumptions:
- User has Access/Capabilities to the report editor in Cognos Analytics.
- User has Access to / knowledge of a data source for authoring.
- User has basic knowledge of authoring in Cognos Analytics reporting.
Table of Contents
What Is a Data Table, and When Would It Be Best to Use One?
A Data Table is very similar to the List data container, but it serves a different purpose. Data Tables are NOT compatible with Excel or PDF output formats, as they are strictly designed to be used in interactive (HTML) mode. If the report being authored requires multiple output formats (PDF, Excel, etc.), the List is probably a better choice. If the requirement is to interact with the report online, and to have the ability to expand/collapse, apply quick filters, show visual indicators, etc., then a Data Table is the answer… and there is no need for any custom controls or JavaScript development!
OK, let’s build a simple report and incorporate a Data Table.
Building a Report using a Data Table
Once again, we’ll use our favorite sample package, GO Sales (query) for our example, and specifically within the “Sales (query)” namespace. We’ll create a Data Table that shows Revenue and Gross Profit, for Retailer types, by Product Line within each year.
- Create a new report and select the GO sales (query) package. On Page1 of the report, drag from the collection of insertable objects, within the DATA CONTAINER section, a Data table onto the report page. Name the query “Report”. The blank data table will look very similar to a blank List object.
- From the Sales (query) namespace in the data source, navigate to the Time query and expand it, then drag Year into the Data table.
- Repeat this process to add 4 more columns, Product line, Retailer type, and from the Sales query subject, added Revenue and Gross profit. Your Data table should look something like this, in Page design mode:
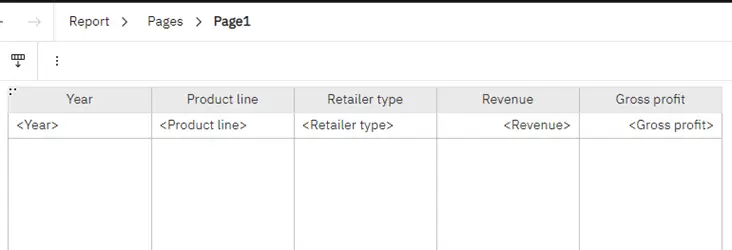
- If you run or change to Preview mode, you will see the data, and it will look remarkably similar to what you would see in a List. To bring out the benefits of a data table, we need to set some properties on it, most notably, set the groupings. Select the data table and go to the Properties window at the right of the report.
- By default, there are no groupings set, so the first thing we will do is set up the groupings. Click on the 3 vertical dots icon at the right of this property. The Grouping and Summary dialog box will appear. Check both Groupable columns, Year and Product line, and expand detail columns to see the rest of the columns:
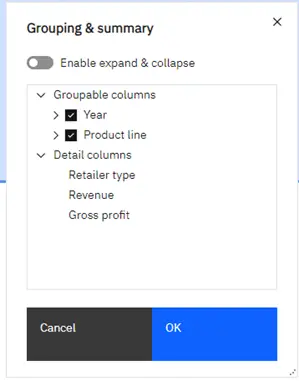
- Click OK and preview the report again. You will now see the data in the table is grouped by Year and Product line… but it still just looks like what we’d get in a list. We need to set the other properties of the data table.
- Bring up the Grouping & Summary dialog again, and this time set to Enable expand & collapse. Click OK and preview again, and now you should see the expand/collapse features are available.
- By default, the rows will be expanded on rendering. Below, I have collapsed 2010 and 2011:
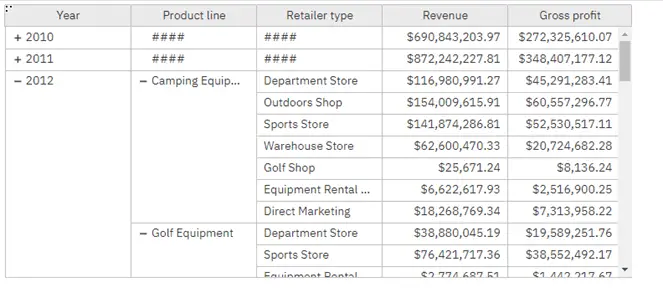
- To change so the grouped rows are collapsed initially, go to the properties of the data table again and enable the Initially collapsed property.
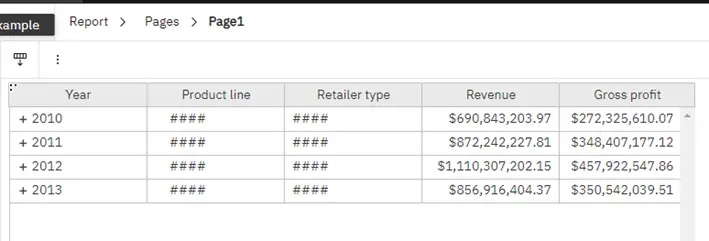
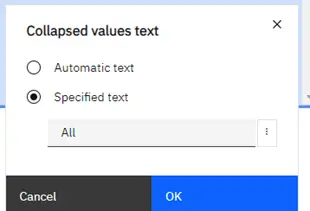
- As you can see above, with each Year initially collapsed, there is a value of “####” showing for Product line and retailer type. This isn’t very desirable, so let’s update another property to get a more useful default value. On the data table’s properties, locate the Collapsed values text, which should currently show “Automatic”. Click the 3 dots icon at the right of this and select Specified text, and then change the default text to “All”
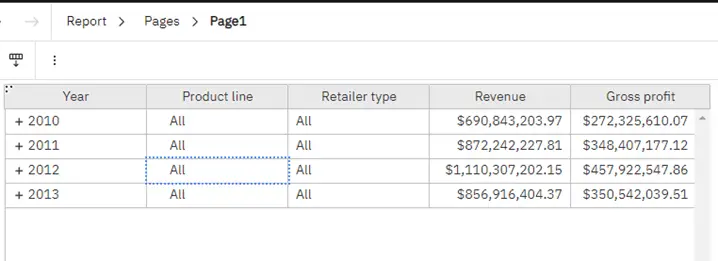
- Preview the report again and now you should see something like this:
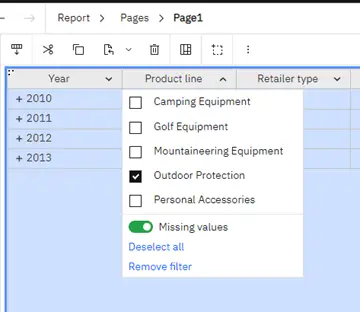
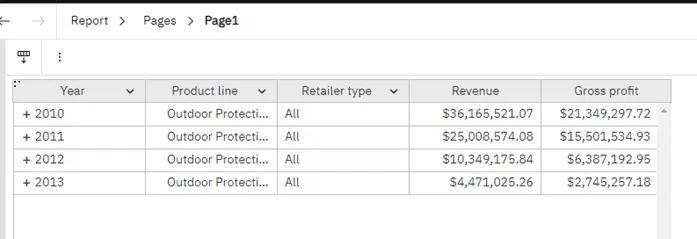
- Next, I want to enable column filters that are very similar to the column filters you might use in Excel. Again, in the Data table’s properties pane, locate the Show column filters property and enable it. Below I have previewed after changing this property, and filtered Product line to show just Outdoor Protection, using the new Data table filter feature:
- Lastly, Data Tables make adding a visual indicator a snap, so we will add a column to show if the Revenue met the plan. In Page view mode, drag Planned Revenue from the data source onto the Data Table. You will see all the Planned Revenue values are higher than the Revenue values, so we will adjust it so the expression looks like this so that some are lower than Revenue:
[Sales (query)].[Sales].[Planned revenue]*.935
- Drag a Query calculation onto the data table… name it “Met Plan?” and enter the following expression:
[Revenue] – [Planned revenue]
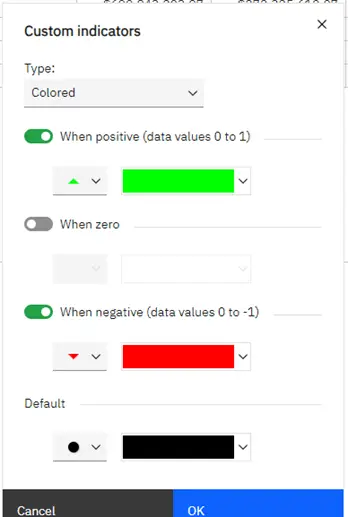
- On the Page view, click on the “Met Plan?” column and go to the Properties pane to the right of the report. Locate the Custom indicators property and click the 3 dots icon at the right.

- On the Custom indicators dialog, set the type to Colored, then set the colors for Positive to Green and Negative to Red, and choose the icon shape desired… I used up and down arrows:
- Preview the report and you will see the “Met Plan?” column is now displaying the appropriate indicator icons:

Other Notes on Data Tables
- There are many other properties that can be set on Data Tables, that are mainly formatting/styling related… please check these out during your exploration of data tables.
- Custom indicators are currently limited to Positive, Zero and Negative classifications… look for this to be enhanced in future releases.
- Expanding/collapsing and filtering is immediate, as these actions do not require re-querying the data source. With data tables, all the data for the lowest level of detail as authored, will be delivered to the browser, unlike some old versions of Cognos utilizing custom expand/collapse functionality.
- Can only be leveraged in reports destined for Interactive/Online (HTML) delivery only
Conclusion
Hopefully this article helped give you a better understanding of what the new Data Table data container is and how it can be used to author more advanced, interactive reports using Cognos Analytics. If you have any questions or need support in optimizing your Cognos environment, don’t hesitate to reach out to PMsquare today.
To stay ahead with the latest updates and best practices, be sure to subscribe to our newsletter for expert insights delivered directly to your inbox.
Published Date:


