
Mark Karas, March 18, 2024
Get the Best Solution for
Your Business Today!
Abstract
This article will cover the Reporting application’s query data item properties, Detail and Summary aggregation and describe how each is used, when and how to set them and what is the effect they have on the report.
Assumptions:
- User has Access/Capabilities to the report editor in Cognos Analytics
- User has Access to / knowledge of a data source for authoring
- User has basic knowledge of authoring in Cognos Analytics reporting
Table of Contents
Detail Aggregation Property
The Detail Aggregation property is easily the more useful and popular of these two properties. Its setting will affect both crosstab and list reports in a similar manner. The Detail Aggregation property will force the report to aggregate using the specified function to the lowest level of grouping. While this setting at the report level exists, the more effective setup will have the preferred aggregation type set in the model (Framework Model, or Data Module).
a) Only for relational data sources
b) A setting in the report query’s data item properties will override any existing setting in the model
With Detail aggregation setting of Total:

With Detail aggregation setting of Average:

Summary Aggregation Property
The Summary aggregation is available for the author to set how the data item should be aggregated by default at higher levels, when using the built-in Summary functions in Reporting.
Here I have both a list and a crosstab using the same query, and I have added Default summaries to both, using the Summary toolbar.
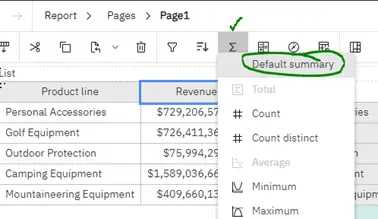
The Summary aggregation is typically going to be set to Default, as shown below. In this case, default appears to be Total and that may be set in the model, or it may just be what Cognos interprets as the natural aggregation type for this data item:

Here I have altered the Summary aggregation setting to be Average… as you can see, the crosstab’s summary is now showing the Average, while the list’s summary still shows the rows totaled up:

For a list to use this property, the Summary row must be created in more manual fashion, which I will walk through next.
Remove the Overall-Summary row from the List so you are back to the original list showing the 5 Product lines, and this time, use the List headers & footers setting to add an Overall Summary:
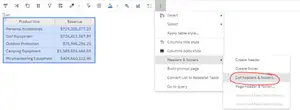
Select Overall footer and click OK… a new Overall summary row will be added to the List.

As you can see, there is no value showing in the List’s Overall summary row, so let’s make a couple changes to make that happen.
- Click on the Overall summary row cell and click Split cell toolbar…
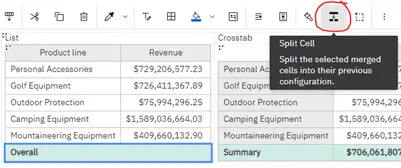
…which will make 2 separate cells.
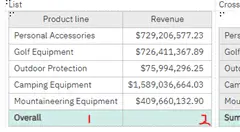
- Unlock the report, and then drag the Revenue data item from Query1 into the empty cell under Revenue. The Summary aggregation type will be applied to the column Revenue and the result is the Average, as desired:

Conclusion
Hopefully this article helped give you a better understanding of the Detail and Summary aggregation properties for a data item in Cognos Analytics. They both play an important role in how your list or crosstab aggregates at both lower (Detail) and higher (Summary) levels of your reports.
Detail and Summary Aggregation Example
If you have any questions or would like PMsquare to provide guidance and support for your analytics solution, contact us today. Be sure to subscribe to our newsletter for more PMsquare updates and insights delivered straight to your inbox.
Published Date:


