
Share


Danny Gargus, August 9, 2021
Get the Best Solution for
Your Business Today!
Scheduled reports are a staple at most companies. Some companies have thousands that run each night and others may have just a few. If you’re new to Cognos and want to schedule and monitor your jobs, how do you keep up with all of the report runs and failures? And what are the options for a failure when you find one? Let’s break it down.
Pro Tip: Want to skip the hassle and get automated notifications when a schedule or job fails? Check out Thrive!
Table of Contents
Monitoring Scheduled Reports/Jobs
If you’re an old pro at Cognos then most of what I am about to explain is probably nothing new to you. But if you’re new to Cognos then the following information may be helpful to troubleshoot or diagnose any problems you’re having. Let’s look at the options we have for monitoring our report processes. There are several ways we can look at these, and the options you have will vary based on your security access and capabilities. Most everyone should have access to the first method which is to click on your personal menu in the top right corner (the icon looks like a person) and selecting “My schedules and subscriptions”.
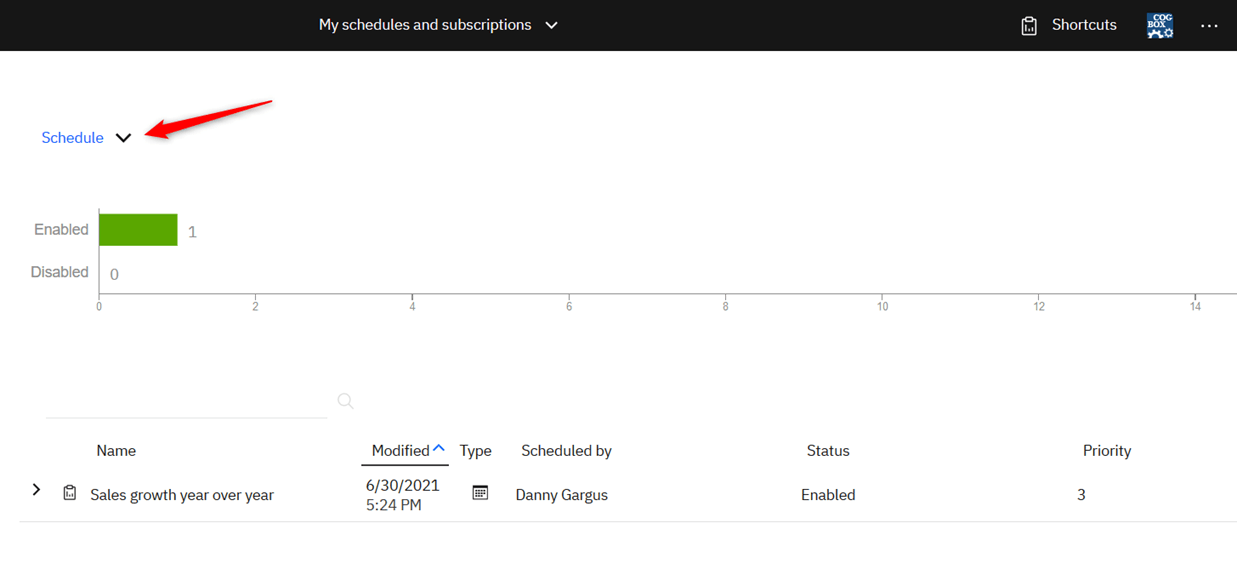
This screen shows all of the schedules that I have created whether or not I own the report in question. Clicking on the dropdown next to Schedule allows me to change to a different view. The Upcoming view shows me all of my reports for the date that is displayed in the top center of the page. I can click on this and change the date to see what reports I have scheduled for future dates. It also breaks out the list by canceled or suspended jobs.
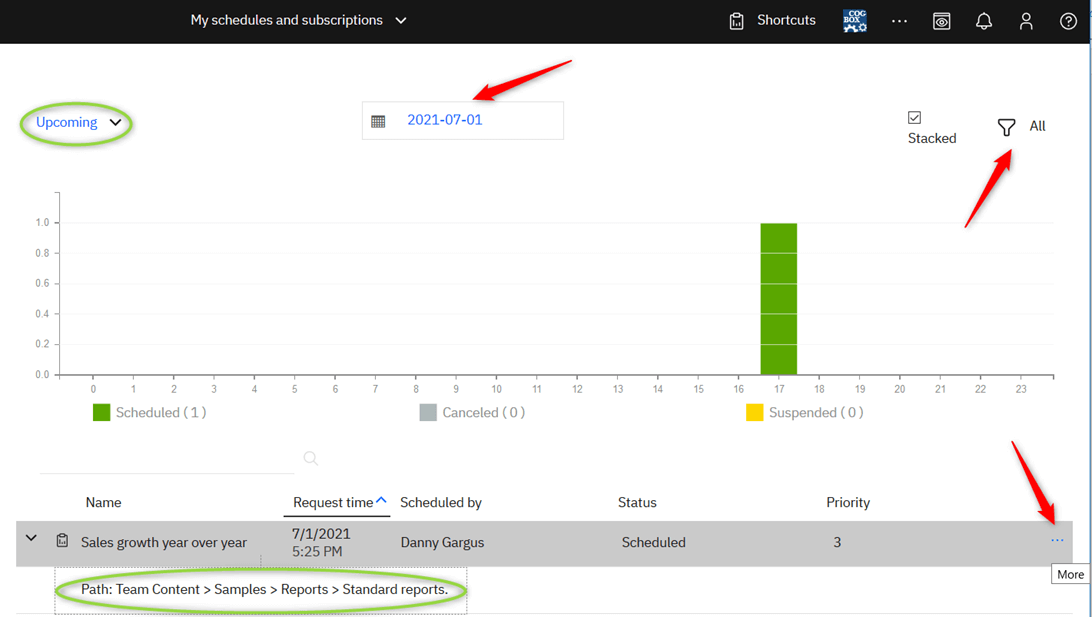
You can sort your reports by any of the fields except for name (although you can search by name) by clicking on the column header and choosing the up or down arrow for ascending or descending. Clicking on the arrow next to the report name will show you the path to the report which is very helpful. There are also many filter options if you click on the filter icon in the upper right corner.
Clicking on the ellipsis on the right side for any report will give you options, based on the screen you are looking at, to run it, change the schedule, view versions, cancel, etc.
Selecting Past will show you a list of all past report runs and the status of them – whether they succeeded, failed, or were canceled. Here we have the same options for sorting columns and date selection to look at past dates. Selecting current shows any jobs that are actively running along with their status.
The second method is to click on Manage on the lower-left Nav Bar and select Activities. If you don’t see Manage, or you have that but don’t see Activities when you select it, then you probably don’t have the required permissions. Contact your Cognos administrator if this is something you need.
The difference here is that we can see all of the reports and jobs that have been scheduled or run for the entire company. When we click on the “More” ellipsis we get an additional option for the scheduled reports which is “Use my credentials” so, if we’re logged in as a service account, for example, we can use that account to run a report if needed.
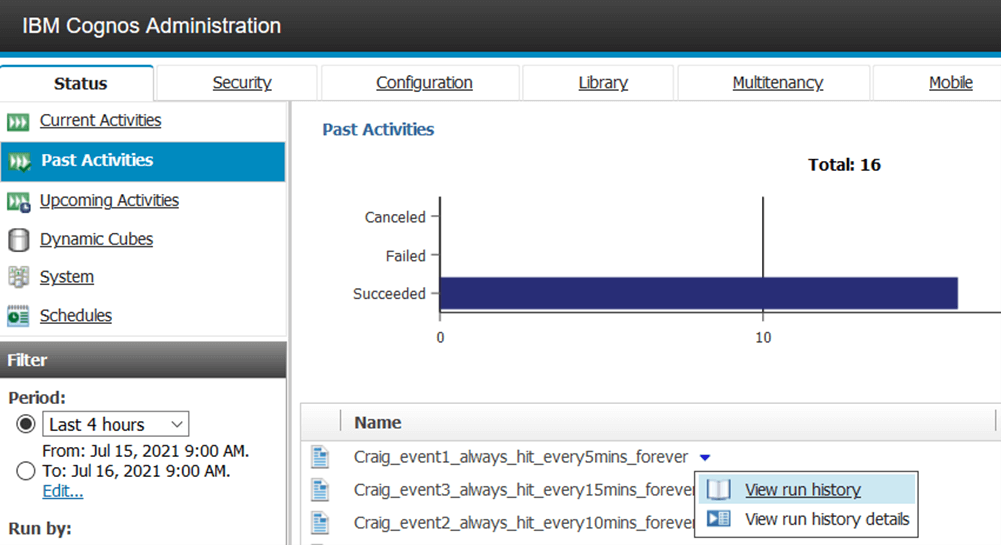
The third method is also to click on Manage on the lower-left Nav Bar but instead select Administration Console at the bottom of the list of options. Once again, if you don’t see Manage, or you have that but don’t see Administration Console when you select it, then you probably don’t have the required permissions.
The Admin Console opens a new browser tab and, for someone with full administrator access, contains a lot of options for security, configuration, and monitoring. We’re just focused on the monitoring so we’ll stay in the default “Status” tab that comes up when opened. Current Activities is selected by default and we can see the other options on the left-hand side for Past, Upcoming and Scheduled activities. Clicking on these gives you the same options as we’ve seen before except that the menus for the reports are now located in a drop-down arrow right next to the reports.
Investigating Cognos Failures
So now that we know how to find our scheduled (or interactive) reports and jobs what do we do about it? Well, if everything shows up successful then we don’t have to do anything and can go back to playing Solitaire. But if we have reports that failed then we probably need to look at those to see if any action is required.
View Run History Details
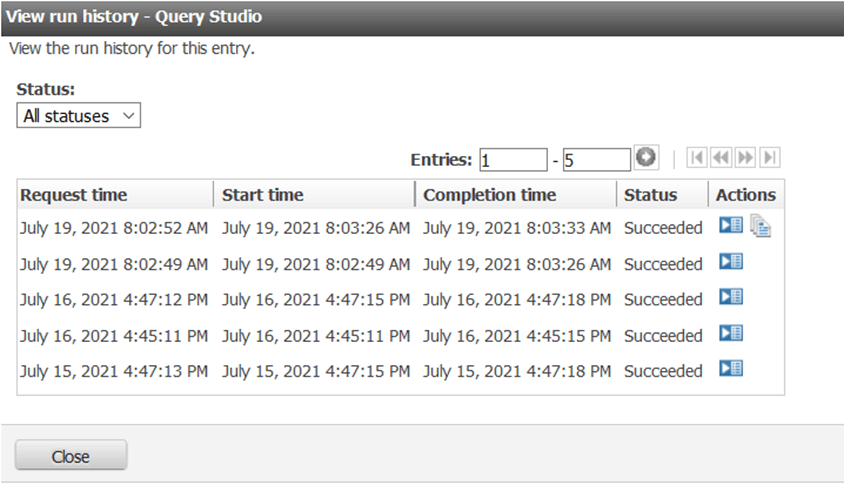
Selecting “View run history” in the drop-down next to a report, query, etc. will show you the last several runs with the times, status, and an actions column. If there are report outputs you will see an icon that looks like pages and clicking on that will allow you to view the output versions.
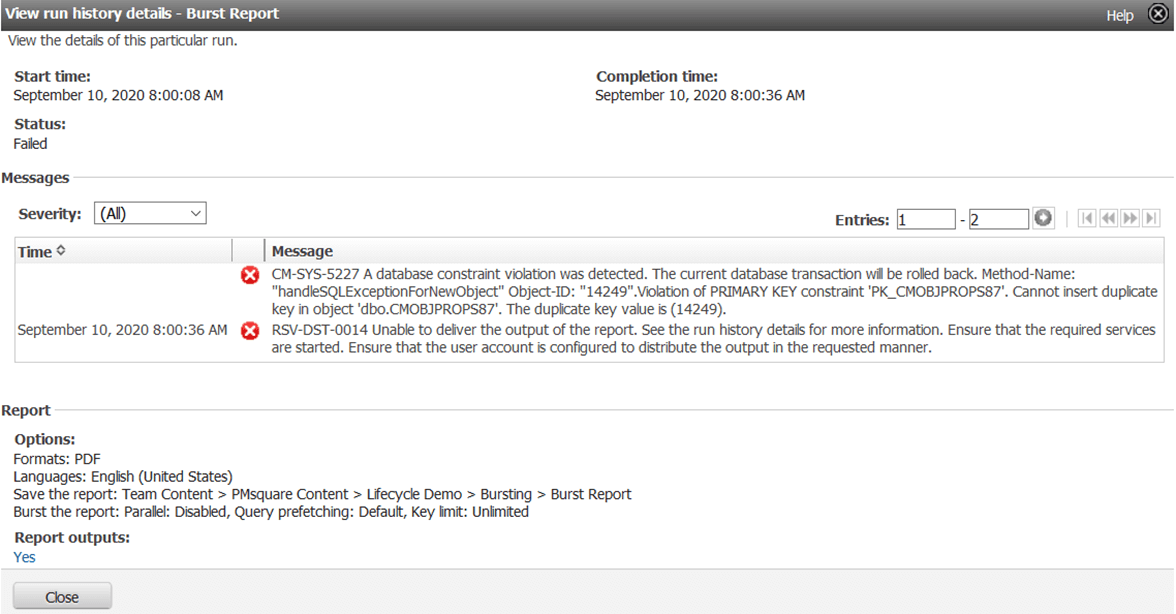
Clicking the Actions icon that looks like a play button will bring up the run history details and give you more information on whether the report was successful or not. For jobs that failed this will give us a pretty good description of what the problem is. Some are relatively easy fixes such as a required parameter was missing in which case you can rerun the report and supply the requested parameter. Others are more complicated and require further investigation.
If you are checking the status of a job, which may consist of multiple reports, then the run details will give you the overall status of the job but won’t display the status of the individual reports. In this case, it would be best to view the Run history details which will show you what part of the job failed.
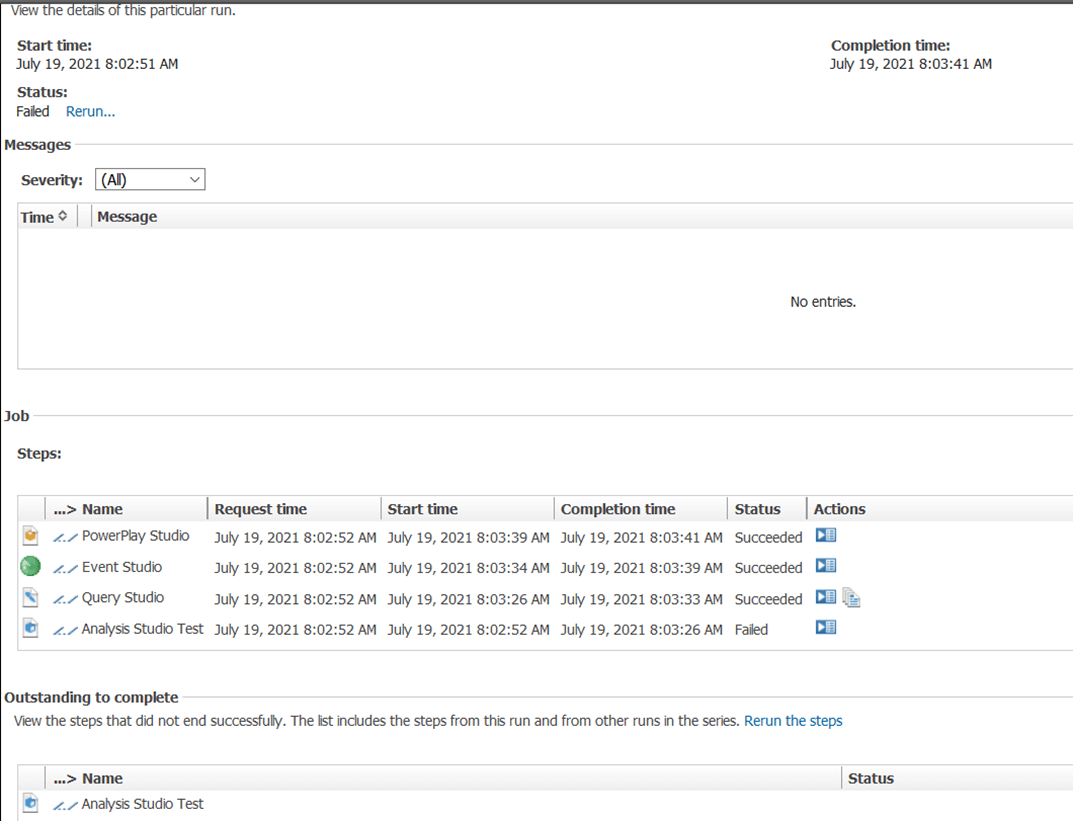
In the above example, only one of the job steps failed. If we know what the issue is and have fixed it, we can click on “Rerun the steps” and get the option to only rerun the steps that failed.
Use the Audit Package
Now let’s look at some other ways to investigate what the issues with the report runs are. We have already mentioned the first which is to view the run history details. Another way is to make use of the Audit package. If you don’t have an audit database configured, we highly recommend it. The audit database keeps track of many things such as login information for your users, report execution details, and so forth.
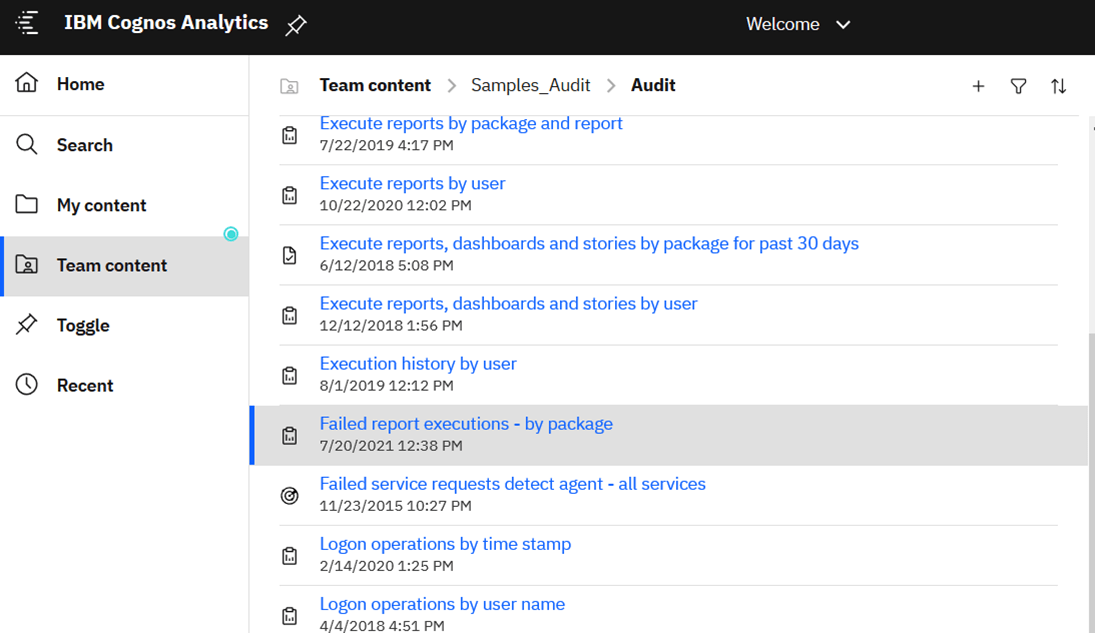
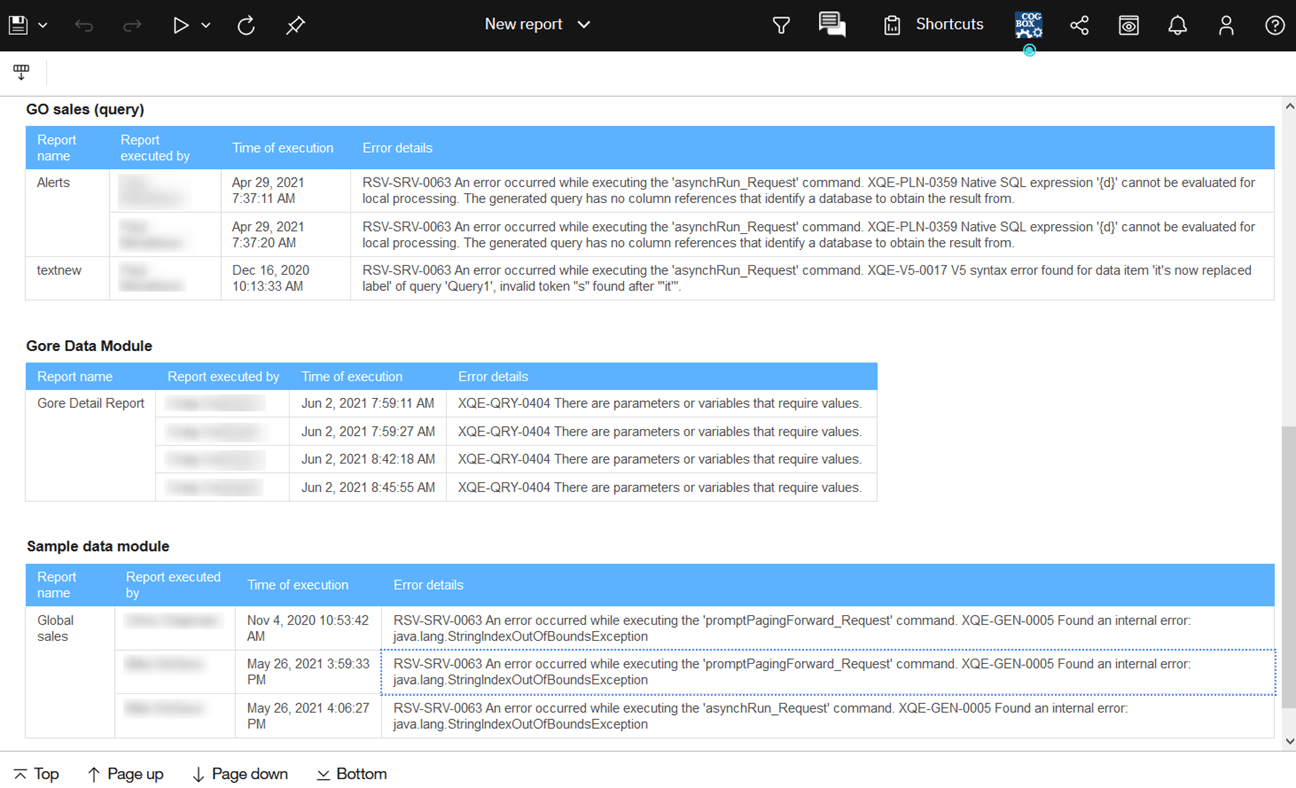
If you have an audit database configured you can use the IBM supplied Audit package and pre-defined audit reports to glean information from your environment. Once the audit samples are installed the package will show up under Team Content. The included reports are located inside the Audit package itself. In this case, we are interested in error messages so we can start with the report “Failed report executions – by package”.
Edit the report, and with a few quick changes, we can see the error details. Add the field “Error details” from the “Run Reports” query subject to our query and report page and we can see the results for all of our failed reports. Since the report has a prompt for package, we can select all or choose a specific package. Again, the report can be modified to display any items you want to see.
Using the audit package allows you to track errors over time as well, more so than searching for them through the Admin console. You can filter for specific error messages to get an idea of how many are being generated over time. And you can limit your results to a specific time range much easier.
Go to the App Server
A third way to view error messages is by going to the app server itself where your Cognos environment is installed. If you are using IBM-hosted Cognos in the cloud then you do not have this option since the servers are controlled by IBM. But if you have your own installation then you can navigate to <install location>/logs on the server.
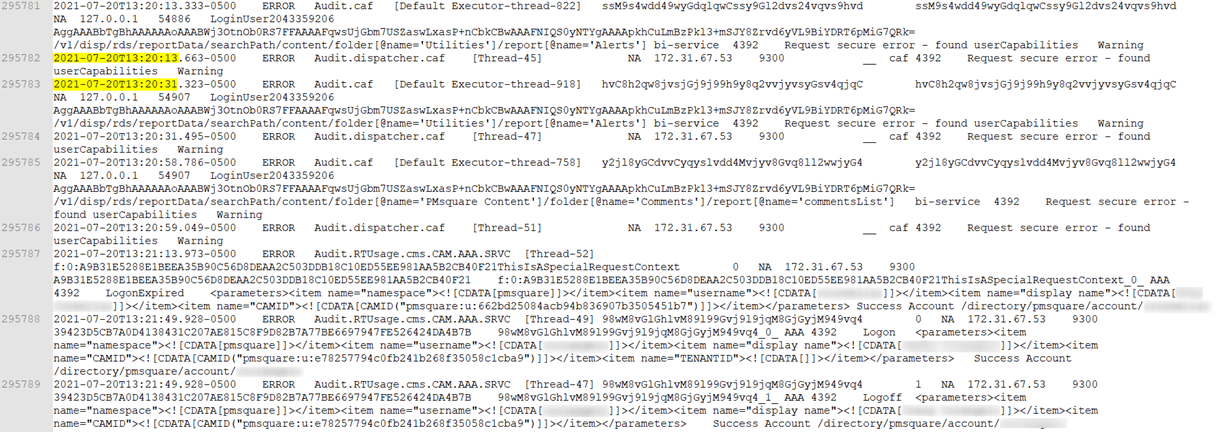
The file you’re looking for is cognosserver.log. Depending on how your environment is set up you may have more than one of these in this directory with extensions like .1 and .2 etc. Once a log file fills up Cognos automatically starts a new one and either deletes the old one (so in your configuration you should account for the saving of more than one log file at a time) or renames it with a new extension so you have a history of sorts.
I’ll grant you this is not the best way to view error messages. The length of the file and the amount of information in it can be extensive depending on the logging level of your environment. However, if you have the timestamp of the error message, then you can zero in on your problem since the messages are in timestamp order as I’ve highlighted below. You can see by the almost 296,000 rows in ours, these files can be large and cumbersome.
In addition, unless you save all of the log files you may not be able to locate the error message in here from errors that occurred even as recently as a week ago. But these log files are critical if you need to open a support case with IBM for an error you’re receiving. They will most likely ask for this file to help them troubleshoot your problem.
Conclusion
Ideally, your Cognos environment will never mess up and none of your reports will ever fail. For those of us not living under a rock, we know that this just isn’t the case. Eventually, there will be issues. We hope that this guide will help you find them and at least determine what the problem is. If you need help solving your issues let us know. We’re here to help!
Next Steps
We hope you found this article informative. Be sure to subscribe to our newsletter for data and analytics news, updates, and insights delivered directly to your inbox.