

Share


Mike DeGues, July 12, 2021
Get the Best Solution for
Your Business Today!
We’ve put together our list of the top 7 Cognos tips for June! Check it out and share your thoughts (or tips!) in the comment sections below.
Table of Contents
1. Help, the save button is disabled!
Ever found yourself in the middle of working on a report, and suddenly you get stuck with a partially rendered modal dialogue box up that won’t close. Because of the dialogue, the save button is disabled! Don’t panic… if this happens, open your browser dev tools (F11), go to “console”, choose the active frame from the dropdown, and then paste this into the console:
Application.GlassView.hackUnlockGlass()Press enter and your save button will become active and functional! Save your report, close the browser tab, and open a new tab to keep working.

2. Stop uploading icons as images, just use HTML
Uploading images to a server for basic iconography in a dashboard is so pre-pandemic. As long as your Cognos server can connect to the web, a few lines of custom HTML can get you access to numerous icons that can be formatted easily and scale to any size flawlessly. Just drop this in an HTML item:
<style>@import url('https://fonts.googleapis.com/css?family=Material+Icons');</style>Reference this page to find the icon you want to use, then add another HTML item where you want to use it. The code will be something like this:
<span class="material-icons">arrow_circle_up</span>Keep in mind that you can color and size the icon by setting properties on the object it sits inside of (block, table cell, etc.)!
3. Let me see the SQL generated by a dashboard!
Dying to see the SQL gen’d by a dashboard?? It’s not as simple as we’d like but sure is possible…
- find xml file xqe.diagnosticlogging.xml file in install_dir/configuration
- find code <eventGroup name=”JDBC”> at about line 120 and change it to <eventGroup name=”JDBC” level=”info”/>
- save file
- restart Query Service (which kills any running DQM queries)
- do something in dashboard to make sure it runs and logs (filter, etc)
- find xml file name like xqelog-dss-% (most recent date modified) in install_dir/logs/XQE
- go to the bottom of that logfile and scroll up until you see the SQL
- turn off logging via the xqe.diagnosticlogging.xml file (roll that changed line back to <eventGroup name=”JDBC”>)
- save file
- restart Query Service again
4. I can’t reconcile report numbers against the source check, what do I do…?
If you can’t reconcile your report numbers against the source check:
- filters – detail v. summary – even “detail” filters filter summary values (remember summarizing data is Cognos’ default behavior) unless you specify it should filter every row from the DB
- Look at aggregation behavior for detail and summary. If you are telling Cognos to average averages it is likely you won’t match the overall average calculated from the source.
5. “Color code” your environments to avoid working in the wrong one
Ever find yourself in the Test environment thinking it’s Production? It’s really easy to change the color scheme for each environment to make it clear which one you’re in. Start by going to your Test environment, then to the Manage panel, and select Customization. Hover over the selected theme, and click the three dots at the end of the line to download it. This will give a zip file that contains a spec.json file. Open the json file in your favorite text editor and update the appbarBackground property to a color that will stand out. Here’s an example:
{"brandTextSmall": "IBM Cognos Analytics","images": {"altText": "CA Logo","favicon": "images\/favicon.ico","brandIcon": "common-CA_Avatar_Colour_64","brandIconSmall": "common-CA_Avatar_Black_24"},"schemaVersion": "3.0","brandText": "IBM Cognos Analytics","name": "IBM Carbon X TEST","colors": {"appbarForeground": "#fff","appbarBackground": "#CC5500","navbarSelectLine": "#0f62fe","navbarPushButtonBackground": "#e0e0e0","navbarForeground": "#161616","appbarSelectLine": "#0f62fe","navbarBackground": "#fff","appbarPushButtonBackground": "#393939"}}
Save the file. In File Explorer, right-click on the file and send it to a compressed zip. Back in your Test Cognos environment, click the Upload Theme button in the Customization panel. Refresh the page, and you should now quickly recognize that you’re not in Production.
6. Dimensional Authoring tip – using Level information for Styling
Here are 2 ways to leverage the level in the hierarchy to help style the report, when authoring dimensionally (using a cube or other OLAP source). This technique works best when the set in the outer row edge has multiple levels of members… (such as Continent, Country, City)
Initially, a crosstab will not necessarily lend itself to have nice formatting/styling.
- Level indentation
- In Crosstabs, there is a property that can be set on the Row Edge (crosstab node) that will indent the captions based on their associated level in the hierarchy. The most common setting is based on the level in the Hierarchy, but in some implementations, the Relative Setting might be more appropriate
- There is a setting that allows a pixel setting to indicate how much to indent each level
- The indentation can be set to start at a specific level number if desired.
- Conditional Styles utilizing Level Number
- Create a data item to return the level number (e.g. RowLevelNumber)
roleValue(‘_levelNumber’,<some set>) - Include this data item in the row edge’s properties
- Create an Advanced Conditional Style
- Base it on RowLevelNumber data item
- Create a custom style for as many levels as necessary
- Create a data item to return the level number (e.g. RowLevelNumber)
Here is a Level Styling Example.
Before
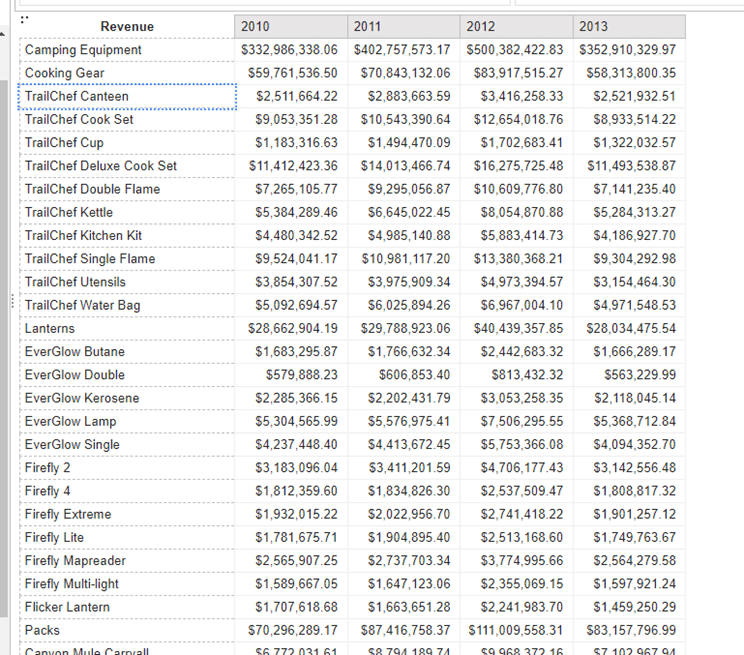
After

7. A shortcut for viewing the metadata of a data module
There is a shortcut that allows you to view the metadata of a data module. When a data module is open, pressing CTRL + Q + / will bring up the View Metadata screen. From here you can see all of the XML for a data module in one place and it might be easier to find something you are looking for. There is also an edit button so you can change the XML on the fly if you so choose. Just be sure to backup your data module before you make any changes to the XML! At the bottom of the View Metadata screen are the sources for the DM and expanding these will show you the properties of all of the fields.

Next Steps
We hope you found this article informative. Be sure to subscribe to our newsletter for data and analytics news, updates, and insights delivered directly to your inbox.
If you have any questions or would like PMsquare to provide guidance and support for your analytics solution, contact us today.