Share


Greg Jungels, March 7, 2021
Get the Best Solution for
Your Business Today!
Table of Contents
Introduction
Have you ever thought it would be nice to be able to add or update some piece of data and have it reflected in your Cognos Analytics Dashboard and/or Reports? Well, now you can, with the IBM TM1 REST API and some Cognos Analytics Custom Controls.
I was on a project where we provided a Cognos Analytics Dashboard to external customers. The dashboard gave them access to several KPIs. However, a lot of the KPIs were dependent, or at least more valuable, if we had some current information from the customers. Without up-to-date information, some of these metrics were useless.
A few problems that needed to be addressed:
- We had to rely on the Account Managers to gather and provide this current data.
- We had to make sure this data was updated continuously.
Enter the IBM TM1 REST API. The IBM TM1 REST API allows you to create, read, update, and delete TM1 data, as well as interact with your TM1 Server in other ways (that’s a different article).
How Does It Work?
For this article, we will be using a Cognos Analytics report, with an IBM TM1/Planning Analytics cube as the data source. You will need to have a decent understanding of Cognos Custom Controls and JavaScript.
A Quick Introduction to IBM Cognos Custom Controls
As our very own “CognosPaul” (or is it “JavaScript Paul”?) has written extensively about, as of Cognos Analytics release 11, JavaScript is now fully documented and supported via Custom Controls. Instead of embedding the JavaScript directly in the report, we now have the means to create and store, re-usable code that we only have to reference in our reports.
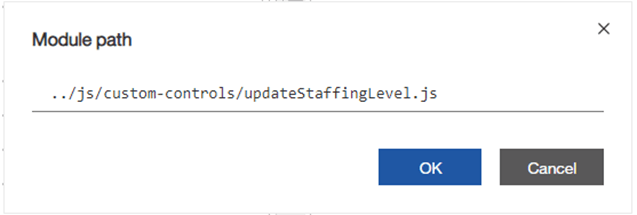
These custom controls can be referenced (Module path) in three ways:
1. Stored in the install location and referenced directly, similar to image files: CognosPaul
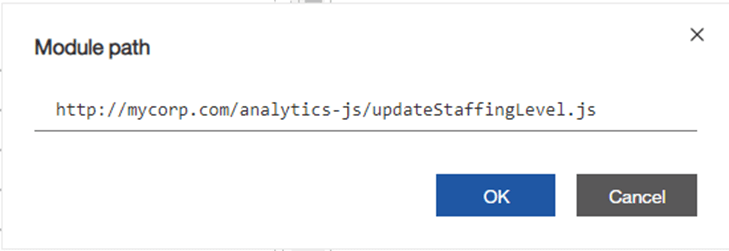
2. Hosted on your webserver:
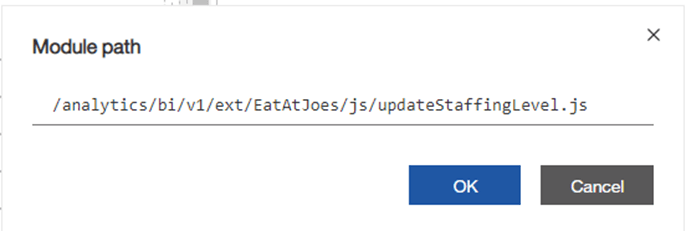
3. Or, if you intend to have a library of JavaScript files, custom visualizations, and images, you can create an extension as we have done here:
Enabling the TM1 REST API
Once you have your Cognos Analytics and Planning Analytics environments up and running, you first need to enable the use of the IBM TM1 REST APIs. This is done by making some changes to the tm1s.cfg file. Depending on how your environment is set up, there may be more steps involved (we can help you with that), but for now, we will focus on the most basic setup. The changes outlined below are all that is required to get started.
- Add the HTTPPortNumber setting and a valid/available port number.
- HTTPPortNumber=[xxxx]
- Configure the UseSSL property, which defines whether a client needs to connect by using the HTTP or HTTPS protocol.
- UseSSL=F
- Start your TM1 Server.
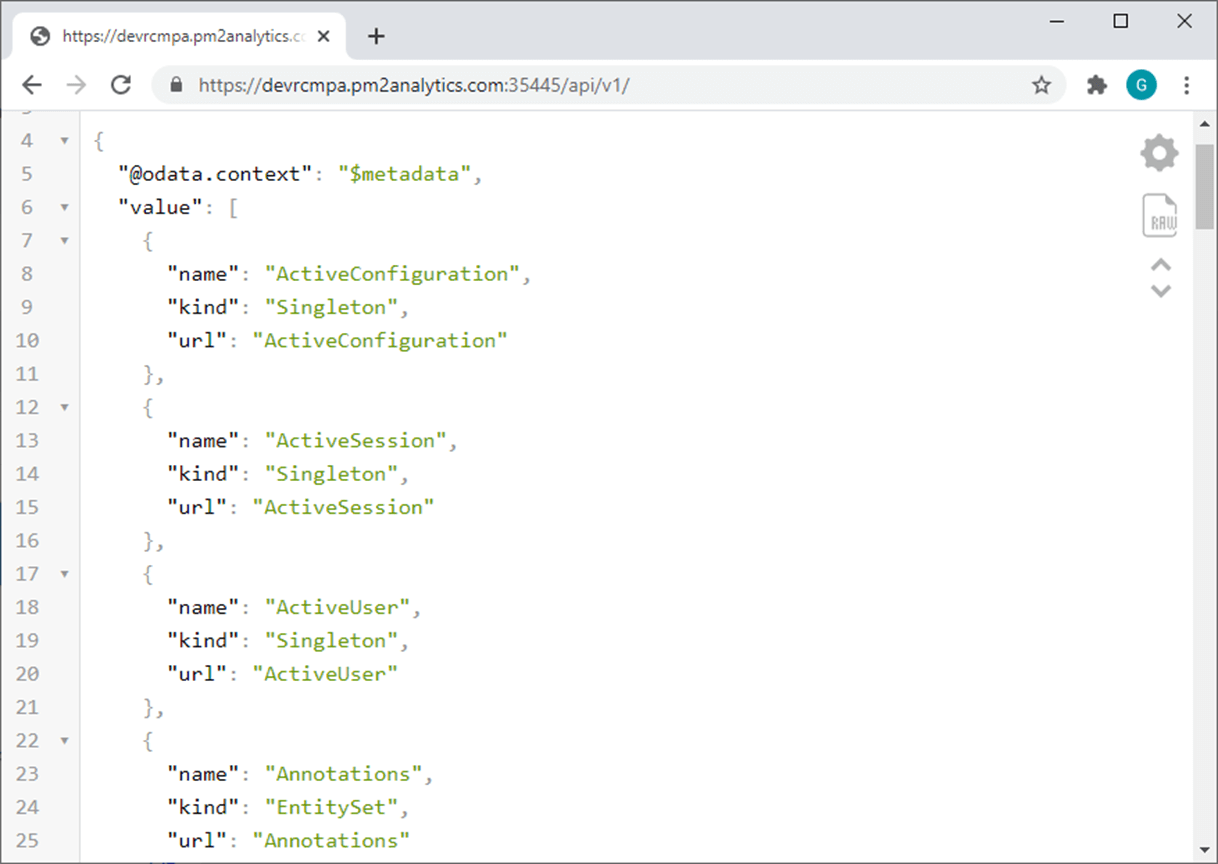
- Open your browser and enter the following:
- http://<fully_qualified_domain_name>/api/v1/
- And you should see something like this:
Let’s Get to it!
For this exercise, we will be working with a Staff Management portal for a fictitious restaurant named “Eat at Joe’s”. The idea here is, to give the user a single portal for their operation. We will focus our efforts on three different scenarios as they relate to Front of the House:
- Updating Staffing Levels for Front of the House, based on daily demand.
- Creating Action Items for the Management.
- Logging daily issues as they pertain to the Staff.
Scenario 1 – Update Staffing Levels
As the majority of our KPIs are related to labor costs, we want to be able to make adjustments as necessary. If the restaurant is slow, we may want to cut staff for the day. If it gets busy, we may want to add staff. By providing management a way to update the staffing level daily, in real-time, they will be able to see the effects immediately, as well as be able to store these updates for future decision making and detailed reporting. They may also utilize these techniques in a “what if?” situation.
As you can see from the screenshot below, we have a Staffing ribbon at the top of our portal. This shows us our Typical Staffing Level, Required Staffing Level, and Staff Needed to Meet Demand. There is also a 30-day Average graph. You may also notice, there is an input box as well as an Update button. This is where the TM1 REST API comes into play.

The first thing we need to do is create a text box prompt, and then add a button by way of a Cognos Custom Control. Once the user inputs a value and clicks on the button, we make an API call which then writes back to the cube. From there, a simple refresh (via the custom control) is all it takes to see the impact. Cool?
The setup:
We first need to add a text box prompt, a calendar control, and a custom control to the report.
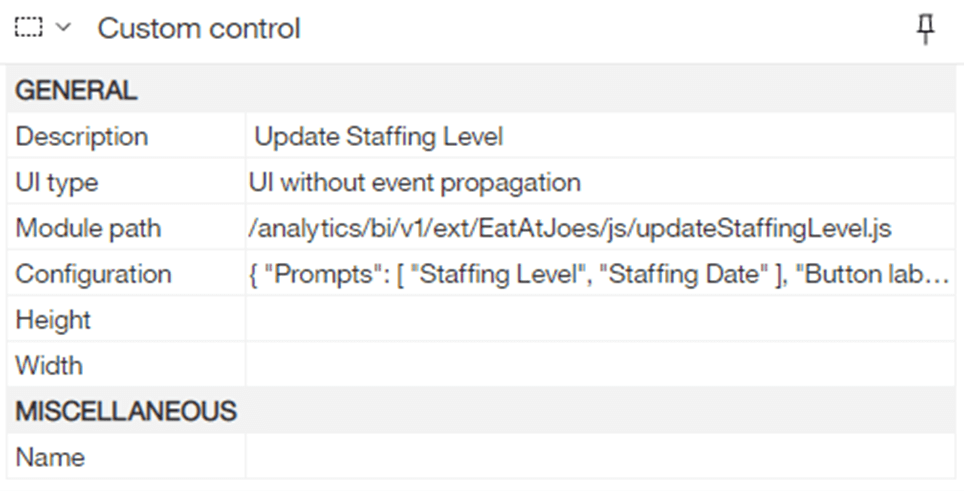
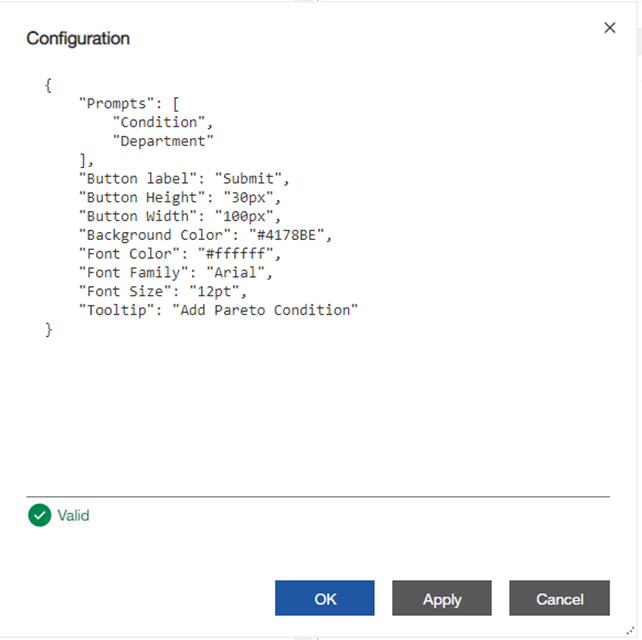
Next, we need to configure our custom control. Other than the module path we talked about earlier, there are only a few other properties that you need to configure. For our example, we need to pass the Staffing Level, as well as the Staffing Date. These parameters will be defined in the Configuration property within the custom control interface as seen below:
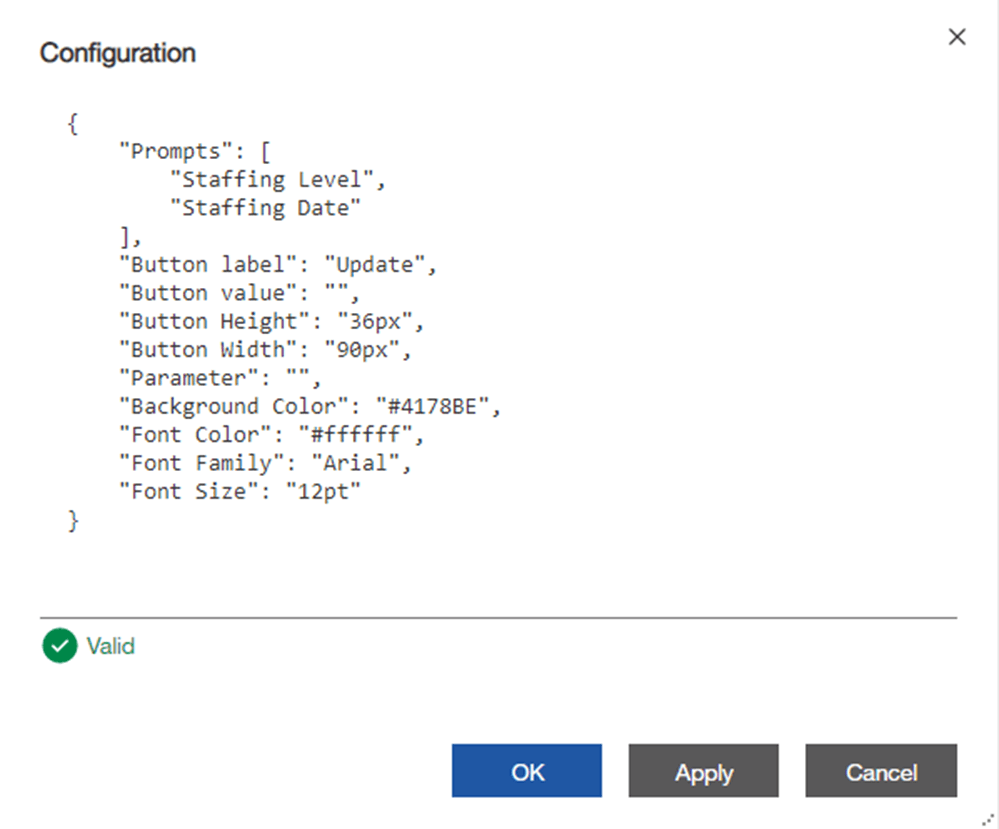
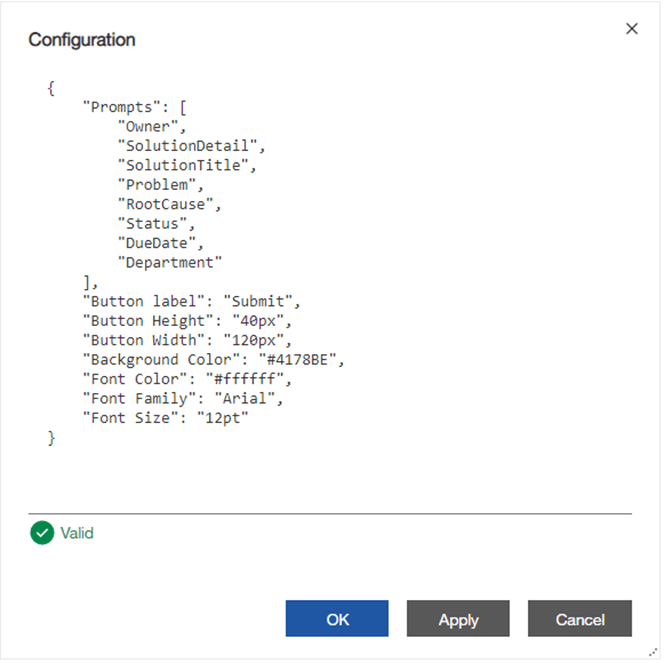
Double-click the Configuration property to open the property editor dialog. Here you will enter parameters in JSON format that will need in the JavaScript. You may notice that we can set parameters for just about anything, as long as your JavaScript supports it. We’ve added the prompts and all of the formatting for our “Update” button. This way, you can easily change the formatting to meet your standards.
Lastly, we create an updateStaffingLevel JavaScript file, which calls the TM1 REST API. This is where the meat of the solution exists.
You’ll see in our “draw” method, we are using some of the values from the Configuration property of the custom control.
updateStaffingLevel.prototype.draw = function( oControlHost )
{
let div = oControlHost.container;
/* Create Update button as HTML */
div.innerHTML = “<button>” + oControlHost.configuration[“Button label”] + “</button>”;
this.m_btn = div.querySelector(“*”);
this.m_btn.onclick = this.onClick.bind(this, oControlHost);
this.m_btn.style.backgroundColor = oControlHost.configuration[“Background Color”];
this.m_btn.style.color = oControlHost.configuration[“Font Color”];
this.m_btn.style.fontFamily = oControlHost.configuration[“Font Family”];
this.m_btn.style.fontSize = oControlHost.configuration[“Font Size”];
this.m_btn.style.width = oControlHost.configuration[“Button Width”];
this.m_btn.style.height = oControlHost.configuration[“Button Height”];
};
Other than some helper functions, the majority of the code will be in the onClick event of the button. We will be calling the tm1.Update function using a POST request from the API.
	updateStaffingLevel.prototype.onClick = function( oControlHost, value)
	{
		…
		/* Get all parameters from the Configuration */
		let o = oControlHost.configuration
    			, vals = []
    			, controls = this.controls
    			, prmpt;
		…

		/*  Setup variables for cube and url  */
		Let paServerlURL = “http://yourpaserver:port”
		let cubeName = "yourcube";

		/* Build the url for the request */
		let url = paServerURL + "/api/v1/Cubes('"+cubeName+"')/tm1.Update";

		/*  Setup variables for prompts  */
		let staffingDate = oControlHost.page.getControlByName("mainDate"); /* Date picker from report */
		let staffingLevel = oControlHost.page.getControlByName("Staffing Level"); /* text box prompt */
This is where we set up and build the POST request. We define the body of the request as where and what we want to update in the cube.
	/*  Set up the headers for the request.  */
	const requestHeaders = new Headers({
		'Content-Type': 'application/json',
		'Accept': 'application/json'
		});

	/*  Define the cell we want to update.  */
	let requestBody = JSON.stringify({
  		"Cells":[
		{
			"Tuple@odata.bind":[
				"Dimensions('Departments')/Hierarchies('Department')/Elements('Front of House')",
				"Dimensions('Time')/Hierarchies('Time')/Elements('" +  convertDate(staffingDate.getValues()[0].use) + "')",
				"Dimensions('Presentation Measures')/Hierarchies('Presentation Measures')/Elements('Staffing')"]
		}
		]
		,"Value":"" + staffingLevel.getValues()[0].use + ""
	});

	/*  Build the request.  */
	const requestOptions = new Request(url, {
		method: 'POST'
		, timeout: 0
		, headers: requestHeaders
		, body: requestBody
		, redirect: 'follow'
	});
Now we fetch the request, checking for network errors first. If we get an error, we display a toast message, otherwise, we use one of our helper methods to cause some latency then refresh the report. This latency allows the cube write to complete.
	fetch(requestOptions)
		.then(response => {
			if (!response.ok) {
				throw new Error('Network response was not ok');
				alert('Looks like there was a problem. Status Code: ' + response.status);
			}
				return
		})
		.then(data => {
		})
		.catch(function (error) {
			parent.__glassAppController.showToast(
				'Unable to update Staffing Level to ' + staffingLevel.getValues()[0].use + ' for ' + department + ' on ' + 						convertDate(staffingDate.getValues()[0].use) + '.',
				{'type':'error', 'btnLabel':'OK'},
			); /* End toast */
		});
			pleaseHold(3000, oControlHost, staffingLevel, staffingDate, department);
		};
	};
Scenario 2 – Create Action Items
You may have noticed a little briefcase with a “+” in it, after the Staffing Ribbon. This button opens an input-able form to enter some ‘Action Items’. These could be anything, from a maintenance request to a Guest-related issue.
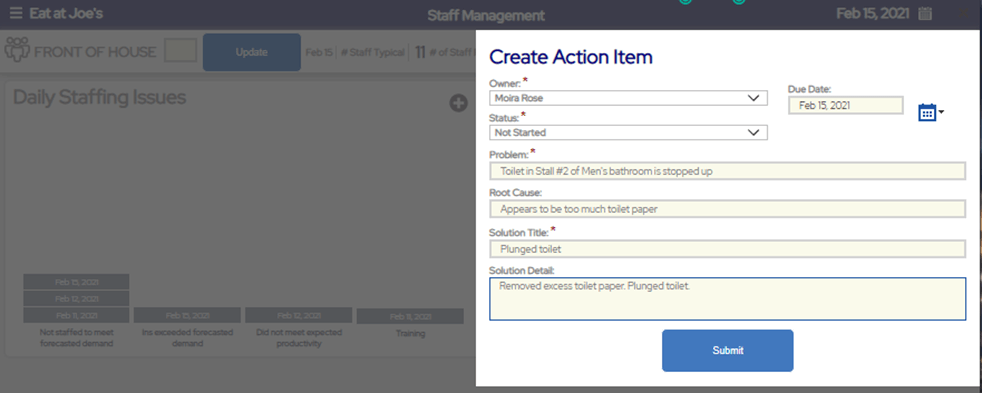
When the user clicks on the briefcase, they are presented with a flyout form. They enter the required information and click the Submit button, which then calls the API and writes to another cube.
Similar to the first scenario, we create another custom control (and another JavaScript file) in which the Configuration property of the custom control has values for all of the fields in our Action Item form.
The main differences in the JavaScript will be adding variables to hold the prompt values, the user logged in, and the fact that we will be writing to several cells.
/* Setup variables for prompts */
let Problem = oControlHost.page.getControlByName("Problem"); /* Problem prompt */
let RootCause = oControlHost.page.getControlByName("RootCause"); /* Root Cause prompt */
let SolutionTitle = oControlHost.page.getControlByName("SolutionTitle"); /* Solution Short Name prompt */
let SolutionDetail = oControlHost.page.getControlByName("SolutionDetail"); /* Potential Solution prompt */
let Owner = oControlHost.page.getControlByName("Owner"); /* Problem Owner prompt */
let Status = oControlHost.page.getControlByName("Status"); /* Problem Status prompt */
let CreatedDate = oControlHost.page.getControlByName("mainDate");
let DueDate = oControlHost.page.getControlByName("DueDate");
let EnteredBy = Application.GlassContext.profile.account.userName; /* Cognos user */
…
let postBody = JSON.stringify([
{"Cells":[{
"Tuple@odata.bind": [
"Dimensions('Departments')/Hierarchies(' Departments ')/Elements('"+department+"')",
"Dimensions('Action Items Rows')/Hierarchies('Action Items Rows')/Elements('" + elementPosition + "')",
"Dimensions('Time')/Hierarchies('Time')/Elements('" + convertDate(CreatedDate.getValues()[0].use) + "')",
"Dimensions('AI Measures')/Hierarchies('AI Measures')/Elements('Problem')"]}]
,"Value":"" + Problem.getValues()[0].use + ""},
{"Cells":[{
"Tuple@odata.bind": [
"Dimensions('Departments')/Hierarchies(' Departments ')/Elements('"+department+"')",
"Dimensions('Action Items Rows')/Hierarchies('Action Items Rows')/Elements('" + elementPosition + "')",
"Dimensions('Time')/Hierarchies('Time')/Elements('" + convertDate(CreatedDate.getValues()[0].use) + "')",
"Dimensions('AI Measures')/Hierarchies('AI Measures')/Elements('Solution Title')"]}]
,"Value":"" + SolutionTitle.getValues()[0].use + ""},
{"Cells":[{
"Tuple@odata.bind": [
"Dimensions('Departments')/Hierarchies(' Departments ')/Elements('"+department+"')",
"Dimensions('Action Items Rows')/Hierarchies('Action Items Rows')/Elements('" + elementPosition + "')",
"Dimensions('Time')/Hierarchies('Time')/Elements('" + convertDate(CreatedDate.getValues()[0].use) + "')",
"Dimensions('AI Measures')/Hierarchies('AI Measures')/Elements('Root Cause')"]}]
,"Value":"" + RootCause.getValues()[0].use + ""},
{"Cells":[{
"Tuple@odata.bind": [
"Dimensions('Departments')/Hierarchies(' Departments ')/Elements('"+department+"')",
"Dimensions('Action Items Rows')/Hierarchies('Action Items Rows')/Elements('" + elementPosition + "')",
"Dimensions('Time')/Hierarchies('Time')/Elements('" + convertDate(CreatedDate.getValues()[0].use) + "')",
"Dimensions('AI Measures')/Hierarchies('AI Measures')/Elements('Solution Detail')"]}]
,"Value":"" + SolutionDetail.getValues()[0].use + ""},
{"Cells":[{
"Tuple@odata.bind": [
"Dimensions('Departments')/Hierarchies(' Departments ')/Elements('"+department+"')",
"Dimensions('Action Items Rows')/Hierarchies('Action Items Rows')/Elements('" + elementPosition + "')",
"Dimensions('Time')/Hierarchies('Time')/Elements('" + convertDate(CreatedDate.getValues()[0].use) + "')",
"Dimensions('AI Measures')/Hierarchies('AI Measures')/Elements('Owner')"]}]
,"Value":"" + Owner.getValues()[0].use + ""},
{"Cells":[{
"Tuple@odata.bind": [
"Dimensions('Departments')/Hierarchies(' Departments ')/Elements('"+department+"')",
"Dimensions('Action Items Rows')/Hierarchies('Action Items Rows')/Elements('" + elementPosition + "')",
"Dimensions('Time')/Hierarchies('Time')/Elements('" + convertDate(CreatedDate.getValues()[0].use) + "')",
"Dimensions('AI Measures')/Hierarchies('AI Measures')/Elements('Due Date')"]}]
,"Value":"" + convertDate(DueDate.getValues()[0].use) + ""},
{"Cells":[{
"Tuple@odata.bind": [
"Dimensions('Departments')/Hierarchies(' Departments ')/Elements('"+department+"')",
"Dimensions('Action Items Rows')/Hierarchies('Action Items Rows')/Elements('" + elementPosition + "')",
"Dimensions('Time')/Hierarchies('Time')/Elements('" + convertDate(CreatedDate.getValues()[0].use) + "')",
"Dimensions('AI Measures')/Hierarchies('AI Measures')/Elements('Status')"]}]
,"Value":"" + Status.getValues()[0].use + ""},
{"Cells":[{
"Tuple@odata.bind": [
"Dimensions('Departments')/Hierarchies(' Departments ')/Elements('"+department+"')",
"Dimensions('Action Items Rows')/Hierarchies('Action Items Rows')/Elements('" + elementPosition + "')",
"Dimensions('Time')/Hierarchies('Time')/Elements('" + convertDate(CreatedDate.getValues()[0].use) + "')",
"Dimensions('AI Measures')/Hierarchies('AI Measures')/Elements('Created Date')"]}]
,"Value":"" + convertDate(CreatedDate.getValues()[0].use) + ""},
{"Cells":[{
"Tuple@odata.bind": [
"Dimensions('Departments')/Hierarchies(' Departments ')/Elements('"+department+"')",
"Dimensions('Action Items Rows')/Hierarchies('Action Items Rows')/Elements('" + elementPosition + "')",
"Dimensions('Time')/Hierarchies('Time')/Elements('" + convertDate(CreatedDate.getValues()[0].use) + "')",
"Dimensions('AI Measures')/Hierarchies('AI Measures')/Elements('Entered By')"]}]
,"Value":"" + EnteredBy + ""}
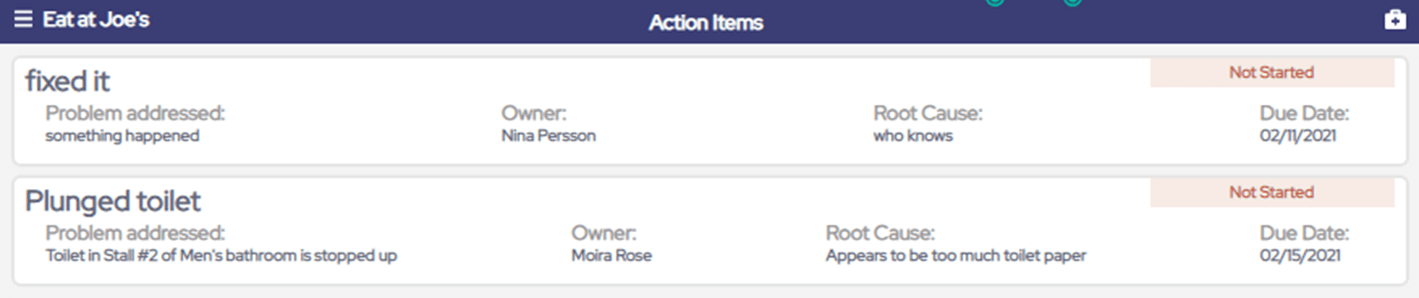
]);As you’ll see in the screenshot below, our “Action Items” page shows this Action Item, immediately.
Scenario 3 – Logging Daily Staffing Issues
In this final scenario, we’ve created a Pareto chart, and have some predefined issues that we want to be able to track. These issues were created as a picklist in our cube.
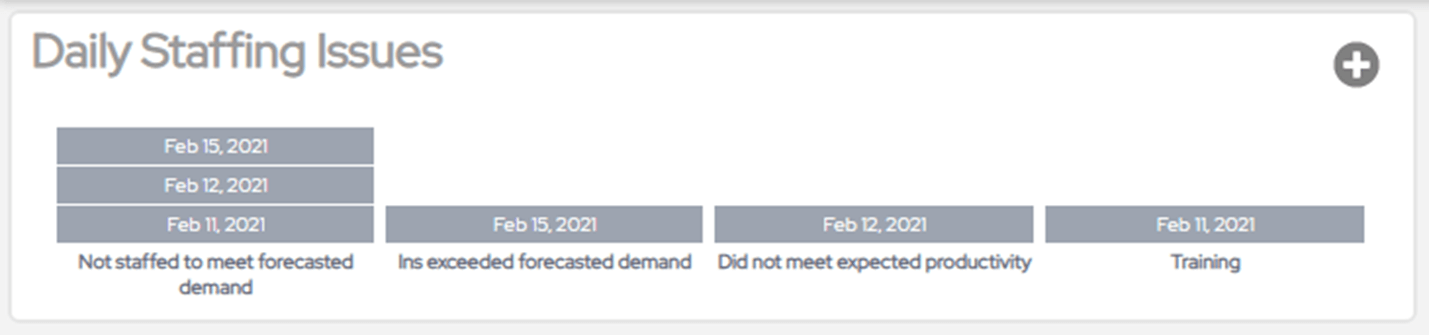
As you can see in the image above, we’ve added a custom button in the top right of the card. When the user clicks on it, a pop-up appears, where they can select any one of the Action Items. Similar to the other scenarios, the Submit button calls the API and writes the value back to a separate cube. Upon returning, the Daily Staffing Issues Pareto chart reflects the added value.
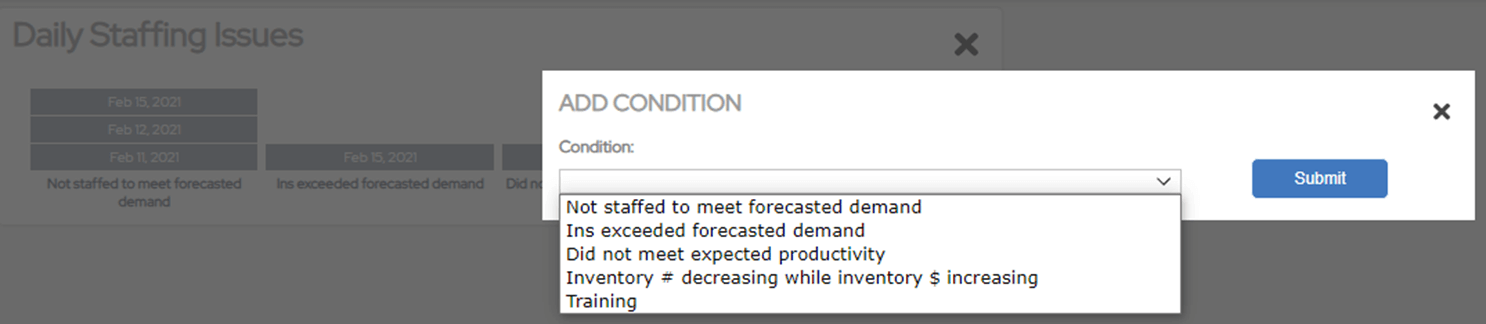
Similar to the scenarios above, we create another custom control (and another JavaScript file) in which the Configuration property of the custom control has values for the prompt in our Add Condition dialog.
For this scenario, all we need to do is write to the Condition and Entered By cells of the cube.
Considerations
One thing you may be wondering is if it is wise to allow everyone to make these updates. Well, we thought about that too, and through security setup and render variables, we were able to limit which users are able to make the updates, as well as when to even display the input/buttons.
Is It Right for Me?
Absolutely! The opportunities are endless. I’m sure you’ve come across a situation where you wish you could make a change to something and see the effect immediately. As I mentioned earlier, in one situation, we wanted to give the external customer an opportunity to update their information themselves.
We’ve even used this technique to kick off a data move process at the click of a button. Here’s the code to do just that:
	/* This function will execute a PA Process. */
	function executeDataMoveProcess(paProcess){
		fetch(paServer + "/api/v1/Processes('" + paProcess + "')/tm1.Execute", postOptions)
		.then(response => {
			if (response.ok) {
				return response.text();
			}
				return Promise.reject(response);
			}
		)
		.catch(function (error) {
			console.warn(error);
			alert('Execute data move failed', error);
		});
	}
Closing
These are just a few examples of what you can do. There are so many possibilities these techniques open up.
- For more information about the IBM TM1 REST API, reach out to us, or follow this link: IBM TM1/Planning Analytics REST API.
- To find additional documentation, visit the IBM Knowledge Center (http://www.ibm.com/support/knowledgecenter).
- To see how to Make Your Own Cognos Controls with the CogBox Control Creator, check out CognosPaul’s article.
Next Steps
We’ve already implemented these techniques at some of our Clients, with astounding results. The team at PMsquare has resources available to help get you started. In addition, we will continue to offer more technical tips and tricks on the latest releases of Cognos Analytics and Planning Analytics in the form of YouTube Livestreams, Planning Analytics tutorials, and future blog posts so be sure to check out our YouTube channel and website.
We hope you found this article informative. Be sure to subscribe to our newsletter for data and analytics news, updates, and insights delivered directly to your inbox.