
Share


Mark Karas, November 8, 2021
Get the Best Solution for
Your Business Today!
Abstract
A guided start for a new user authoring in Cognos Analytics reporting for the first time, cont’d.
Table of Contents
Assumptions:
- The user has built the report from the 1st article.
- There is already a published package or Data Module available to the user in the environment.
- The user has nominal knowledge, understanding of the contents of the package/module.
- The user knows how to log in to Cognos Analytics.
- The user has the capabilities assignments necessary in Cognos Analytics to use report authoring.
- The user knows the name and location of the package or data module that is available for them to author with.
Introduction
So, you have started your first report and got it to a point where it answers some questions and makes sense… now let’s delve into some more enhancements that are fairly common, and not too complex!
Continue Authoring Your List Report
1. Open your browser (Chrome is preferred) and navigate to the Cognos Analytics environment, and log in.
2. Navigate to the folder that contains the report built from the 1st article, and open it in Edit Report mode.
3. We want to add Revenue to the report, and then calculate the Revenue per Unit using the 2 existing columns.
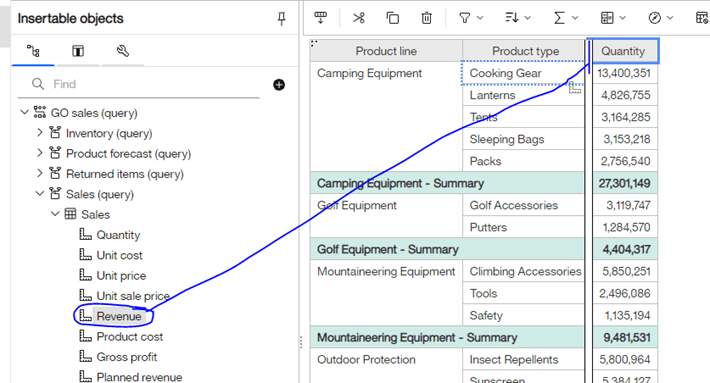
4. From the Sales table, drag Revenue into the list, to the left of Quantity.
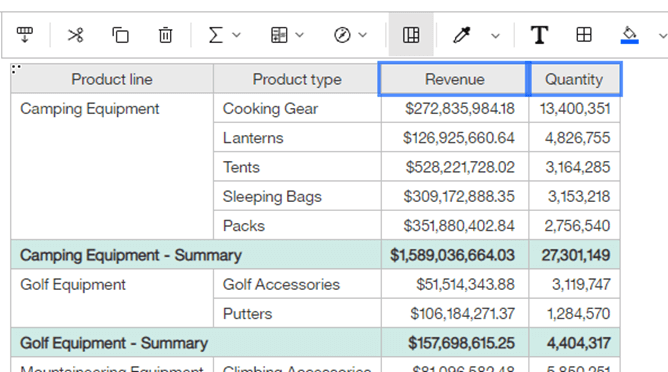
5. Now, to create a calculated column, select both the Revenue and Quantity columns, using Ctrl + <left mouse-click> on the headings.
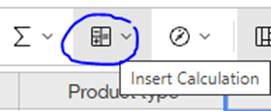
… then click the Insert Calculation toolbar button.
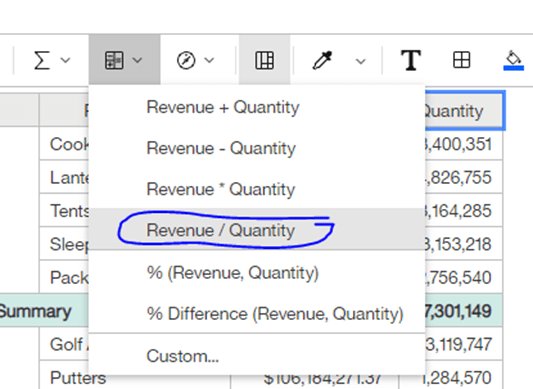
6. You will be presented with a list of choices, where you can choose from 4 preset calculation options, 2 % options, or finally, Custom… to make your own. Let’s choose Revenue/Quantity.
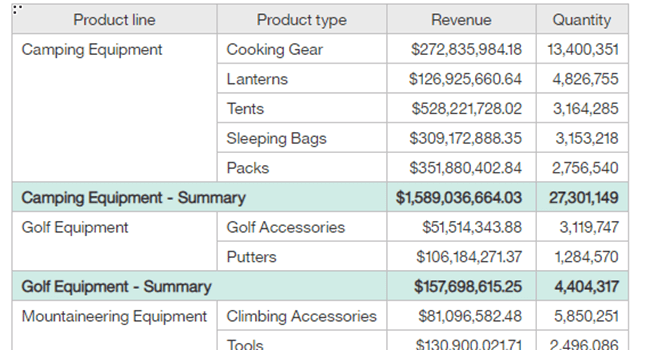
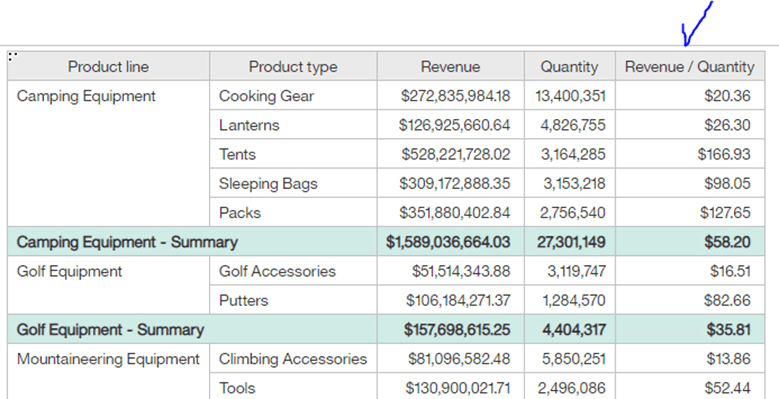
… which will add a calculated column to the list.
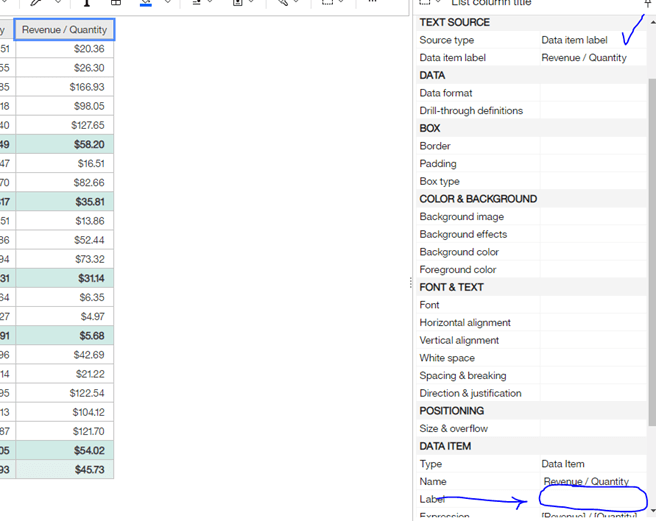
7. While the column is exactly what we need, we’d prefer to name it differently… so to change the heading from “Revenue/Quantity” to “Price” we need to change the source of the text for the heading. Click the heading and then locate the Text Source section in the Properties window at the right. If it isn’t already set to Data item label, please change it to this.
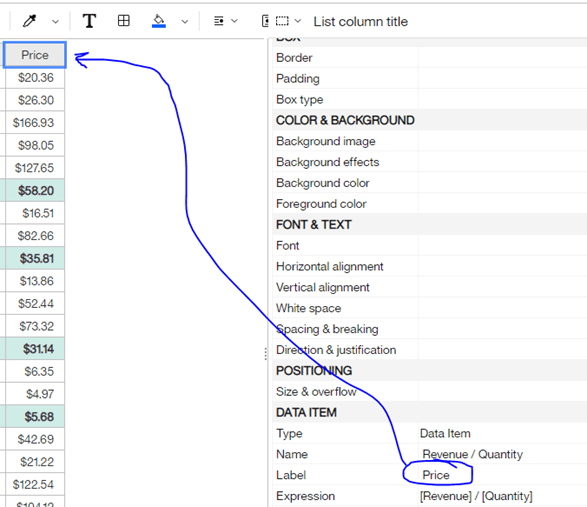
8. Then scroll down in the properties window to the Label property under DATA ITEM section. Type into the empty Label property: Price… and press your enter key. Your column label will adjust to show Price:
At this point your report should look like this:
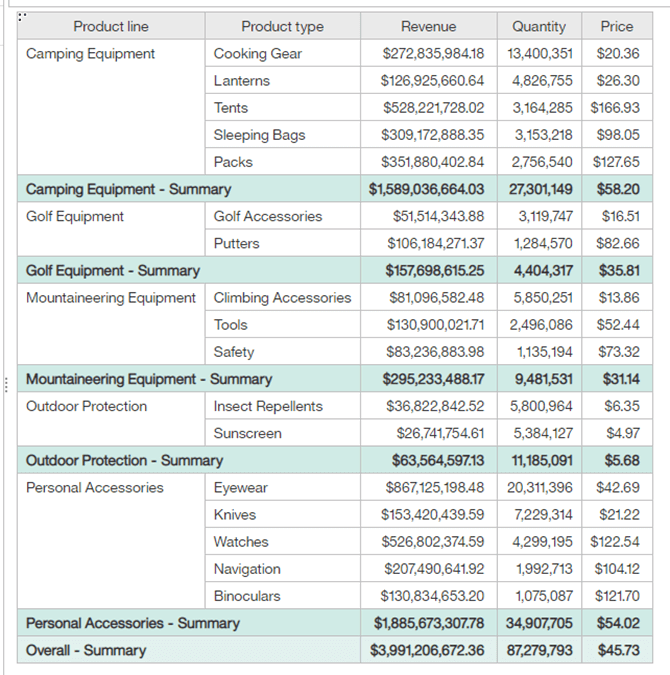
9. Note, the Price values for the summaries calculated properly (after the summing).
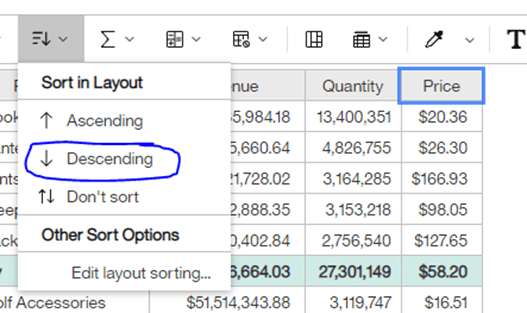
10. Finally, we want to change the sort within the Product lines to use the new Price column, and sort Price descending. This will override the sort we put on Quantity in the 1st article.
Click on the Price heading, then click the Sort toolbar button, and select Descending.
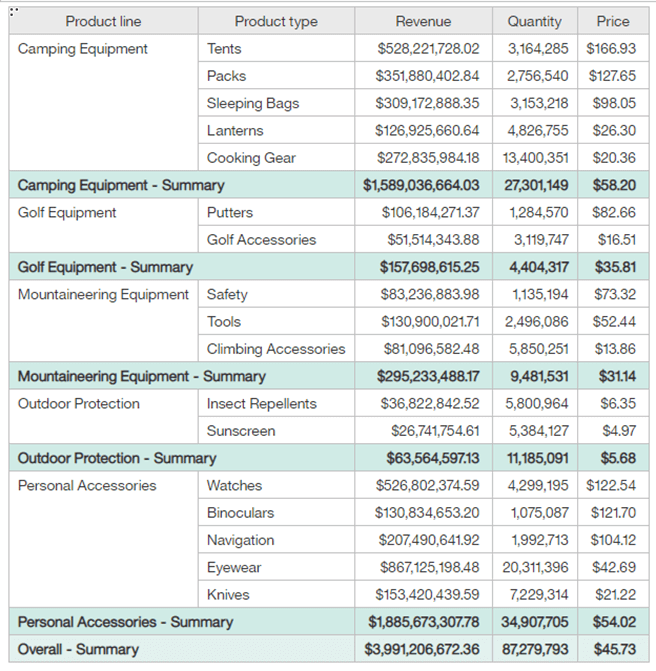
Resulting in:
Next Steps
We hope you found this article informative. Be sure to subscribe to our newsletter for data and analytics news, updates, and insights delivered directly to your inbox.
If you have any questions or would like PMsquare to provide guidance and support for your analytics solution, contact us today.