

Share


Carl Van Zyl, October 8, 2021
Get the Best Solution for
Your Business Today!
During a recent client engagement, I was tasked with the opportunity of altering the source of an existing report from the old legacy reporting tables and replacing this with a new Data Warehouse Fact and Dimension structure. As a further priority, I was asked to review the performance of the report due to the extensive time it was taking to execute during a very limited delivery window each month-end and thereafter implement the necessary improvements.
Table of Contents
In this article, I will discuss how I improved the performance of a complicated report by utilizing MDX and switching to a multidimensional source. This made it possible to reduce the runtime of each selection to under 1 min.
Analysis and Planning
As there was no documentation, report requirement specification or any intellectual property within the team to refer to, it was important to understand and manage the expectation of the client concerning the undertaking of this task. I only had access to the as-is report (5yrs old) and it was therefore necessary to confirm and agree that enough time was allocated to this phase of the project in order to ensure that the solution put forward, would address all the necessary concerns and changes expected.
Key items identified during the initial review:
- The Report was written based on a relational source, but the layout had the composition and feel of that of a multidimensional style report.
- From an overview perspective this essentially listed the most recent 13 periods as columns and would have nearly 60+ measures down the row edges, all relevant to the 13 periods.
- For nearly all the various measures, it would have a subsequent measure Growth on Prior Year, which required its corresponding month from the prior year in order to derive its values.
- A large, dedicated section of the report made provision for the breakdown of several key measures as a proportion of the TOTAL. This repeated across 5 levels of different dimensions.
- During discussions with the report owner a further request was introduced to allow for comparative time fields such as YTD, MTD, Change and Growth to be available as part of the next phase of the report.
- The Report also included measures for Average last 12 months Revenue and Total last 3 months Revenue.
Looking at the Report Design it soon became evident why the report could be experiencing performance issues.
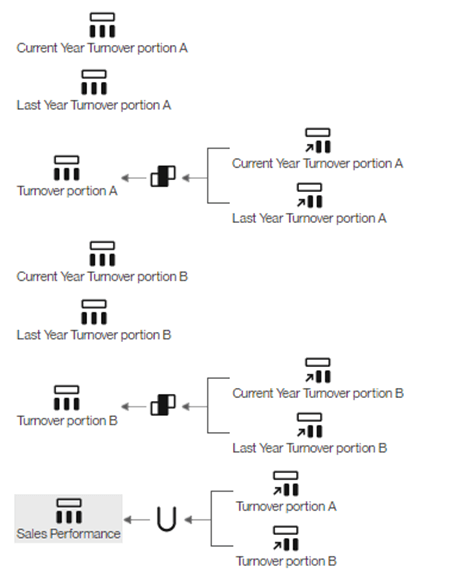
- In order to derive the measures for item 3. and 6. above, the original report developer essentially embraced the technique of joining Current Year data to Last Year data and then further employed the use of Unions to merge the necessary results into custom measures which made up the report.
This resulted in the report being built up, out of over 30+ queries, each having filters for Product, Organization and having to return data for 26 months.
- Most queries had distinct hard-coded business logic in the filters, further contributing to the overall complexity and degradation of the report performance.
Example of the technique used for the As-Is report:
Planning a solution that would address and improve on all these concerns was not going to be so straightforward and a different approach needed to be considered.
Benchmarks:
- Client version of Cognos 11.0.12
- For each prompt of PRODUCT and ORGANIZATION, the report would take between 15 – 25 minutes to render to excel output.
OLAP Consideration:
Due to the nature of the report layout, I felt confident that by using a Cognos PowerCube as a multidimensional source I would be able to deliver an almost exact copy of the report, addressing items 1, 4 & 5 by utilizing the built-in relative time functionality that comes with Transformer and the multidimensional report functionality of % split of row total. (Various other dimensional solutions would also have been possibilities in this scenario, such as DMR in Cognos Framework Manager, TM1 in-memory database, or even SQL Server Analysis Services. I chose PowerCubes for the combination of tool availability to me, ease of cube creation, and the lightning-fast query performance it delivers.)
Making use of cube groups would allow for only the latest 2 periods to be refreshed each month thus keeping the cube refresh time down to within an acceptable timeframe. This offered a huge runtime trade-off against the existing report for the nearly 60+ outputs per Product.
Items 2, 3 & 6 had me scratching my head for slightly longer. After some rumination, I came to the conclusion that in order to solve these problems I would need to write some dimensional (MDX) expressions.
Development
For the purposes of this article, we will be using the GO sales (analysis) model from the Cognos Analytics Samples.
Instead of Organization I will be using members from the Branch Dimension.
The First step to attend to is the part where we need to resolve what I refer to as the “driver” portion of the report. Essentially this is the rolling 13 periods, or in MDX terms, the calculation which will determine the currentMember() portion for all subsequent calculations. From there all measures or calculations will simply display as they are dragged onto the report.
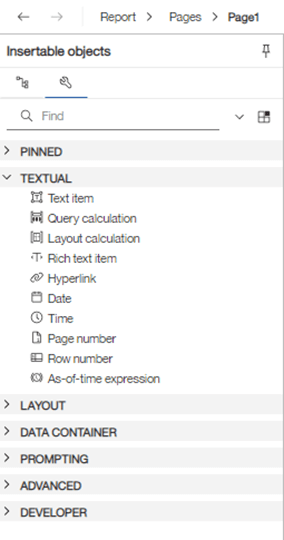
Start by inserting a Query calculation from the Insertable objects:
Followed by the calculation called [Display Periods], which makes use of the Time Dimension’s Month Level:
lastPeriods(13, item( tail([Sales (analysis)].[Time].[Time].[Month]) ,0) ) 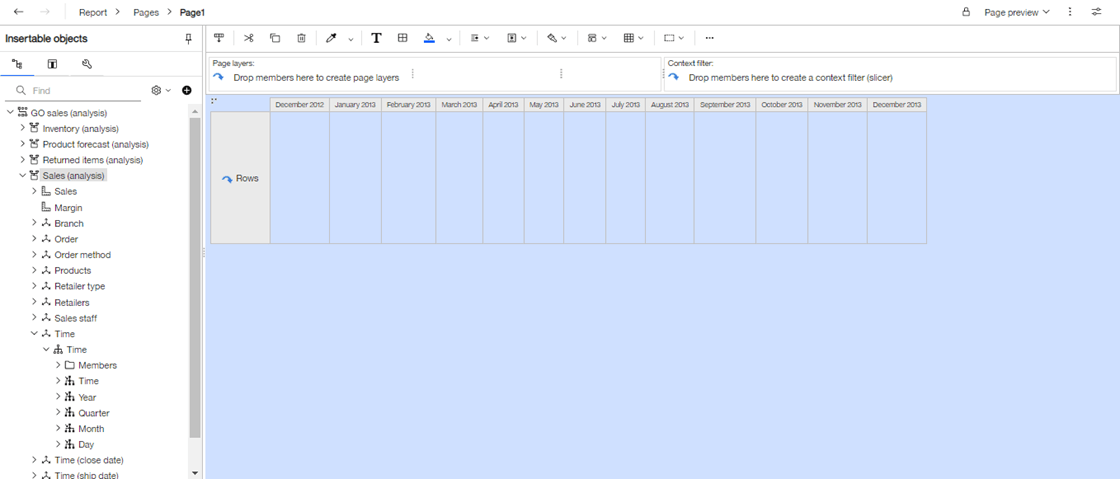
As there is no [Revenue] data available beyond July 2013 for the sample GO sales, we will need to adapt our calculation slightly to include a filter as well, otherwise, we will not end up with 13 periods displayed.
lastPeriods(13, item( tail( filter([Sales (analysis)].[Time].[Time].[Month],[Revenue] is not null) ) ,0) ) 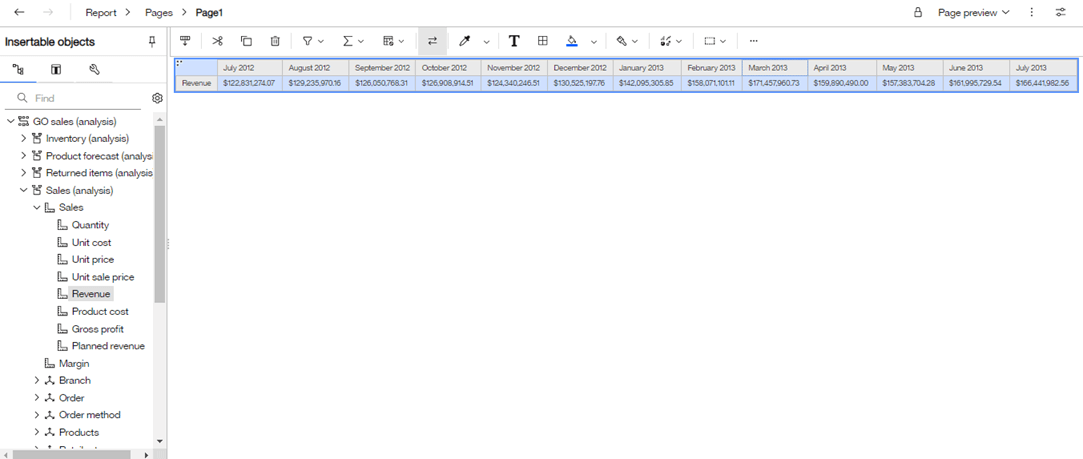
The more calculations and business logic that is pushed to the database the better the performance.
Let me provide an example of repeating business logic captured in query filters between 2 different queries:
Turnover portion A
[TGH_BI_MARTS].[rpt].[NBDashboard].[Branch_code] = [TGH_BI_MARTS].[rpt].[NBDashboard].[Merchant Branch_code] [TGH_BI_MARTS].[rpt].[NBDashboard].[Merchant_account_code] = [TGH_BI_MARTS].[rpt].[NBDashboard].[Merchant Branch_code] [TGH_BI_MARTS].[rpt].[NBDashboard].[Sales_code] not in (‘ ‘, ‘N/A’) [TGH_BI_MARTS].[rpt].[NBDashboard].[Merchant_account_code] not in (999,-1,’Unknown’) [TGH_BI_MARTS].[rpt].[NBDashboard].[Revenue] >= 0
Turnover portion B
[TGH_BI_MARTS].[rpt].[NBDashboard].[Branch_code] <> [TGH_BI_MARTS].[rpt].[NBDashboard].[Merchant Branch_code] [TGH_BI_MARTS].[rpt].[NBDashboard].[Merchant_account_code] = [TGH_BI_MARTS].[rpt].[NBDashboard].[Merchant Branch_code] [TGH_BI_MARTS].[rpt].[NBDashboard].[Sales_code] not in (‘ ‘, ‘N/A’) [TGH_BI_MARTS].[rpt].[NBDashboard].[Merchant_account_code] not in (999,-1,’Unknown’) [TGH_BI_MARTS].[rpt].[NBDashboard].[Revenue] < 0 Hard-coded logic which repeats itself throughout a report, adds complexity when it comes to debugging data problems. This is often confusing and time-consuming for new team members as well as the additional overhead when changes need to be applied. Further cost-saving opportunities could be offered when comparing data storage vs processing resources by pushing some of the abovementioned workload back to the data layer in the ETL part of the DWH.
We, as developers, are constantly striving to ensure that when incorporating business logic, we balance the creation of some of the measures between the front-end and back-end as elegantly as possible.
In this scenario the DWH team was more than willing to accommodate and incorporate the creation of measures constructed with specific business rules in their FACT table, freeing up the front-end solution to focus on rendering pixel-perfect report outputs by merely selecting measures from a Powercube.
Prompts:
The next item would be to allow for the selection of Product and Branch. I highly recommend that before you tackle this section of your requirement, you ensure that you understand the impact of making use of (or rather not) detail filters when developing against a Multidimensional data source. Detail filters may cause ambiguous results, but thank goodness for the generosity of Cognos Paul and his must-read article which addresses the impacts this may have.
Therefore, it is suggested that in a Multidimensional report the report author makes use of a combination of Prompt Macros and the Slicer functionality of Report studio.
Create another Query Calculation [Brand Selection] and for this, we will build up the Prompt Macro as follows:
#promptmany('pBranch','memberuniquename','[Sales (analysis)].[Branch].[Branch]','','[Sales (analysis)].[Branch].[Branch]')# 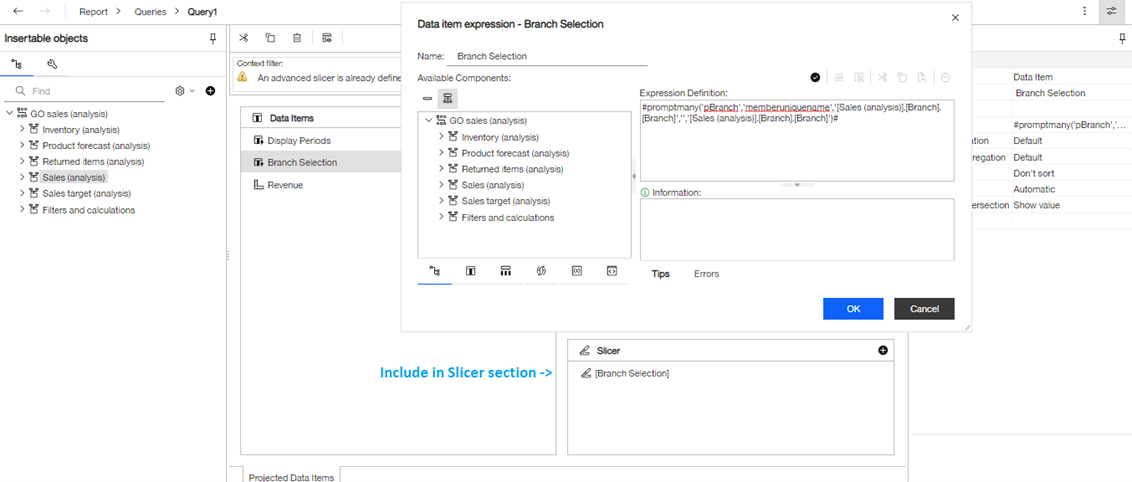
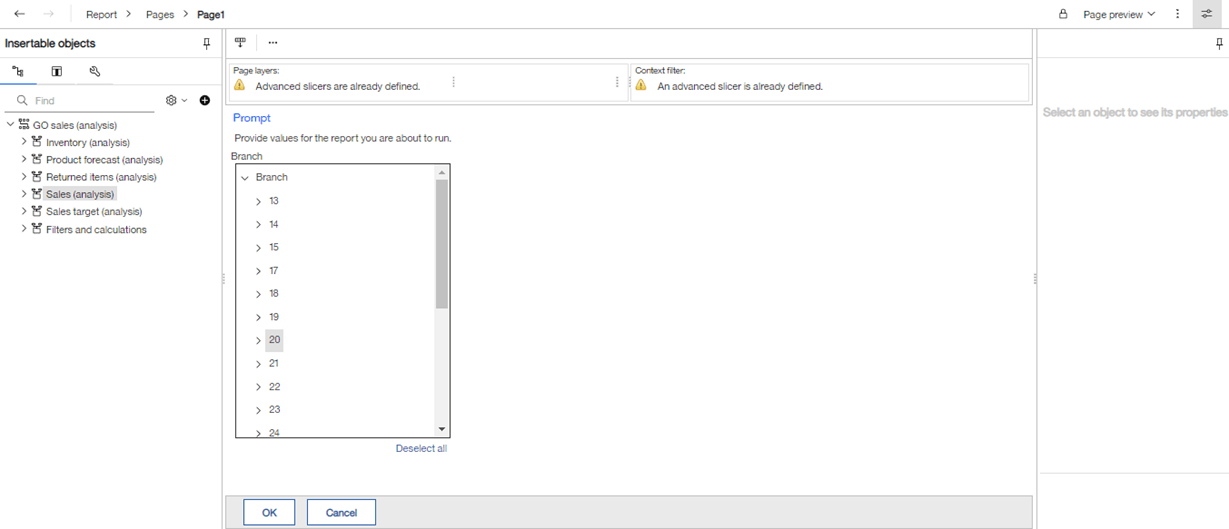
Make sure this is added to the Slicers and if correctly defined you should see a Tree Prompt when you execute the report.
Calculations for Measures:
[Average last 12 months Revenue]
average([Revenue] within set lastPeriods(12,currentMember([Sales (analysis)].[Time].[Time])))
[Total last 3 months Revenue]
total([Revenue] within set lastPeriods(3,currentMember([Sales (analysis)].[Time].[Time]))) [Revenue Growth on Same Month Prior Year]
(tuple([Revenue], currentMember([Sales (analysis)].[Time].[Time])) - tuple([Revenue], lag(currentMember([Sales (analysis)].[Time].[Time]), 12))) / tuple([Revenue], lag(currentMember([Sales (analysis)].[Time].[Time]), 12)) 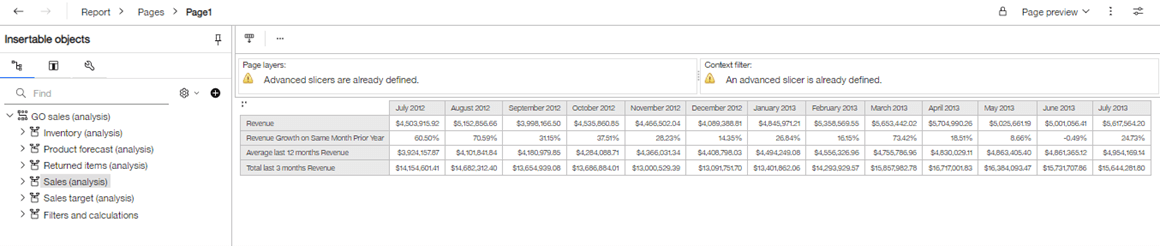
currentMember():
You will notice that throughout all the calculations the currentmember() function is being included. Dimensional sets and hierarchies are read iteratively when a report is being rendered. It returns the current member of the hierarchy during an iteration. When traversing members in a crosstab in a given calculation, the currentMember() function is often used to provide context for the calculation.
References
Conclusion
Although both relational and multidimensional reporting sources each offer various unique capabilities, by making use of a combination of MDX aggregation and family functions available in the multidimensional environment one can easily adopt a flexible approach to report development to achieve almost any reporting requirement.
We hope that this article offers developers of various skill levels the encouragement to explore and discover yet another aspect of report development that Cognos Analytics has to offer.
Next Steps
Be sure to subscribe to our newsletter for data and analytics news, updates, and insights delivered directly to your inbox.
If you have any questions or would like PMsquare to provide guidance and support for your analytics solution, contact us today.