

Share


Mark Karas, November 6, 2020
Get the Best Solution for
Your Business Today!
Purpose
In prior versions of Cognos (Version 7, ReportNet and Cognos 10) there were tools for quickly slicing and dicing a PowerCube… including PowerPlay, PowerPlay Web, PowerPlay Studio, and Analysis Studio, with Analysis Studio also being capable of this same functionality over Dimensionally Modeled Relational (DMR), TM1/Planning Analytics cubes, or other OLAP/Multi-dimensional data sources. These tools are no longer part of the Cognos toolset in version 11.1.n so there may be some users missing this capability and would desire it would be still available. While not exactly the same, this functionality persists in the Reporting application portion of Cognos Analytics. This document will help users understand how to use Reporting to replicate the features they miss from PowerPlay and Analysis Studio.
Assumptions
User has Author capability and access to a multi-dimensional data source and has some familiarity with the Reporting application in Cognos Analytics, and desire to replicate functionality that they used to have in PowerPlay or Analysis.
Table of Contents
PowerPlay and Analysis Studio main functionality
- Multi-dimensional crosstab reporting
- Quick data retrieval, updates on change of layout
- Drilling Down hierarchies
- Context Filtering/Slicing
- Layering
- Apply Filtering, Top n, Bottom n, exclude, expand, etc.
Making Reporting a replacement for PowerPlay and Analysis Studio
My examples are using GO data warehouse (analysis) sample package, specifically in the Sales and Marketing analysis > Sales namespace.
Step 1
Create a new report in Reporting and select a multidimensional data source.
Step 2
Add a Crosstab to the report, name the associated query as desired.
a) A crosstab is exactly the main object from PowerPlay and Analysis Studios, so at this point, we are basically at the same point we’d have been in those tools when creating a new report.
Step 3
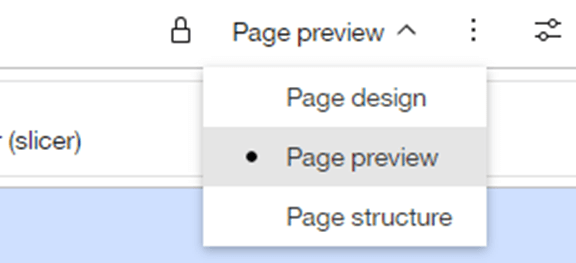
In both PowerPlay and Analysis studio, the default operation was immediate data updates when an addition or change was made to the layout… to replicate this, switch to Page Preview mode using the drop-down in the upper right-hand part of the application nav/toolbar.
Step 4
Like in PowerPlay or Analysis Studio, it is typical to start the analysis by adding rows, columns, and a measure. In PowerPlay, the only option the author had was the member tree. In Cognos Analytics, you can switch between the complete metadata or member only hierarchies. This can be toggled in Insertable Objects > settings > View.
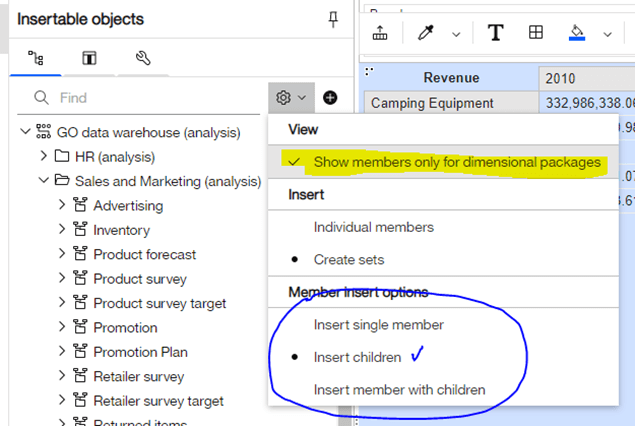
The checked selection (highlighted above) will most closely resemble PowerPlay functionality. Other options are available in this dialog to indicate if you prefer to add the member dragged in, its children, or both. I am using Insert Children for my example, as it is the default in PowerPlay.
Step 5
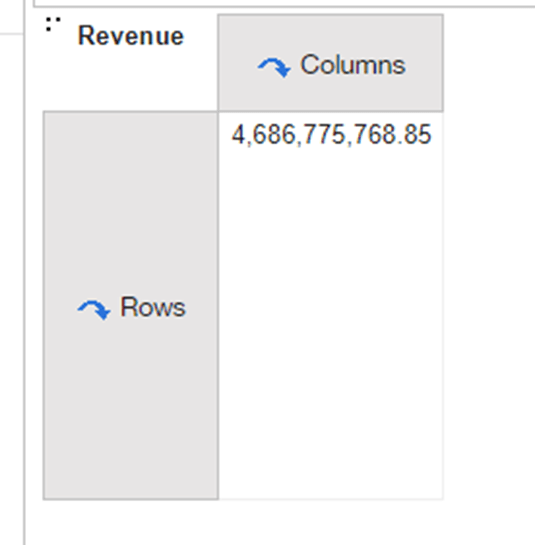
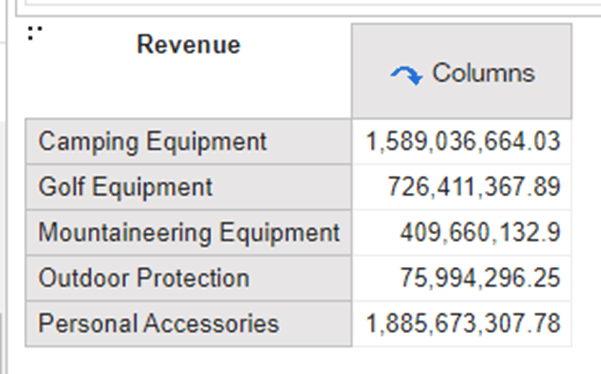
Create an analysis by adding the rows, columns, and measure. For my example I have dragged in Revenue 1st, then Products to the rows next.
Step 6
Finally, I add Time to Columns.
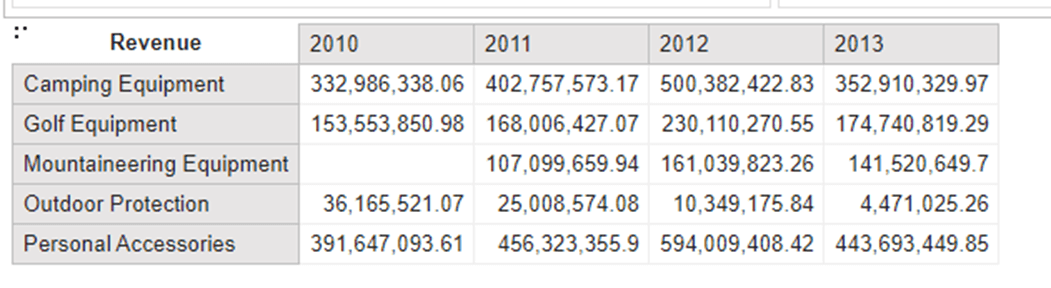
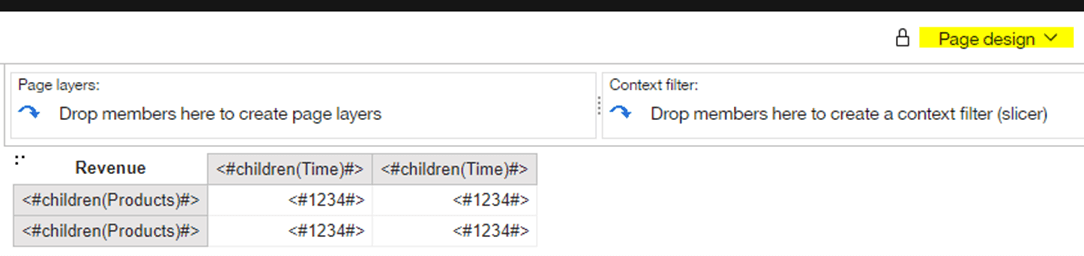
Unlike in PowerPlay and Analysis studio, there is no area that shows what is set in the Rows and Columns. This can be seen in another way in Cognos Analytics, and that would require you to switch to Page design mode.
Step 7
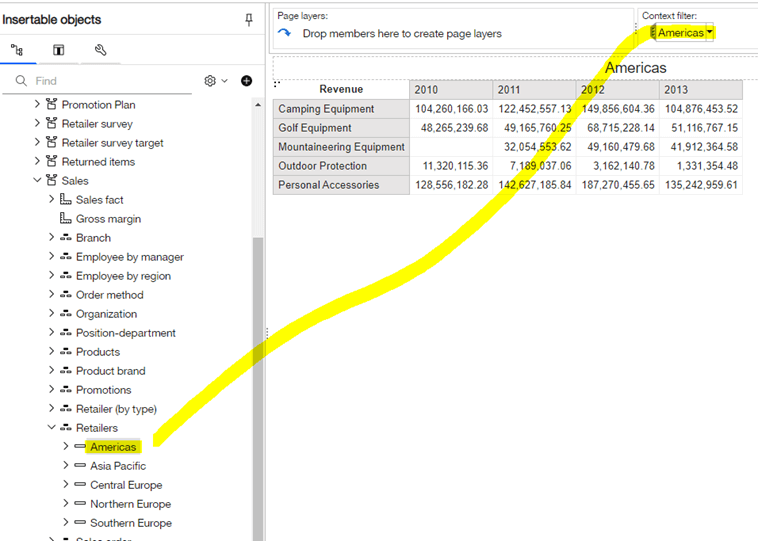
Back in Page preview mode, we will look at Context filtering. Like in PowerPlay and Analysis studio, the author can easily slice the data being shown in the crosstab (without changing the layout using the context filter, or slicer section).
a) Here I am adding the Americas retailer region as a context filter… note the values in the crosstab have changed to reflect only looking at Americas.
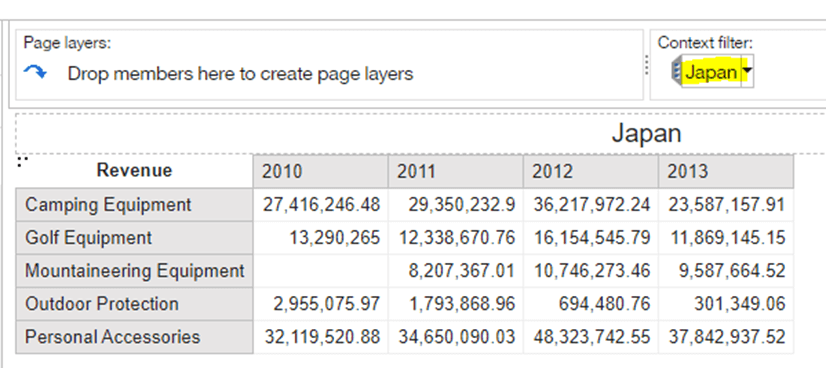
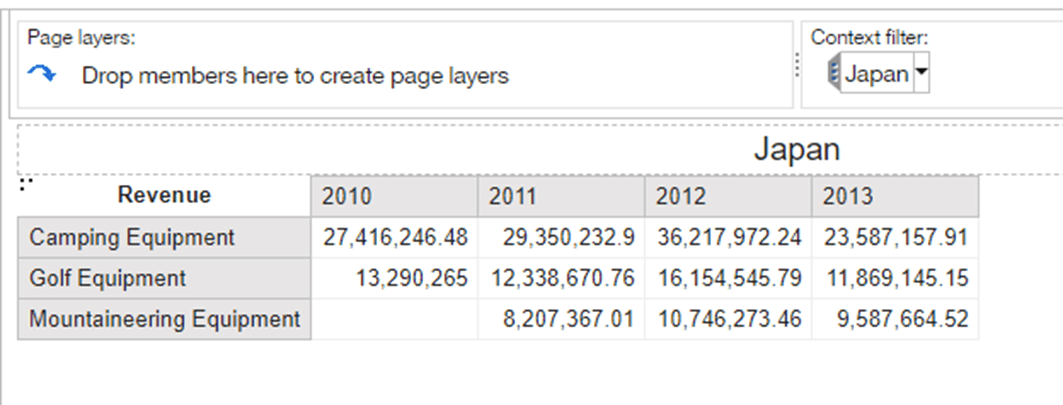
b) The author can use this context filter to change context, by clicking the down arrow at the right and selecting a different member of the hierarchy. I changed to Japan, below:
Step 8
Now we can see how to utilize the Navigation features in Reporting which are a culmination of many features/functions in PowerPlay.
a) For example, we may want to exclude Outdoor Protection and Personal Accessories from being shown in the output.
i) Control + Click on both these members then click the Explore icon in the toolbar, select Exclude members, then choose from Initial set.
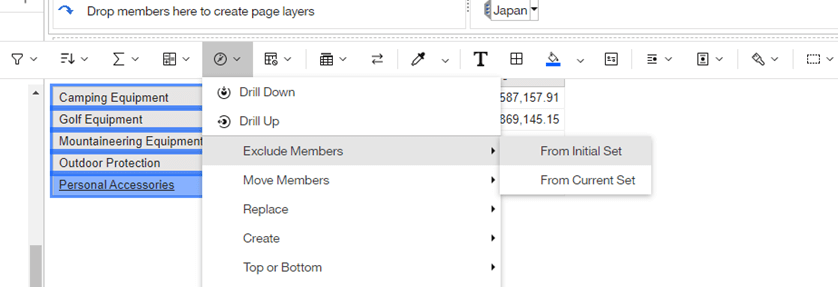
Resulting in:
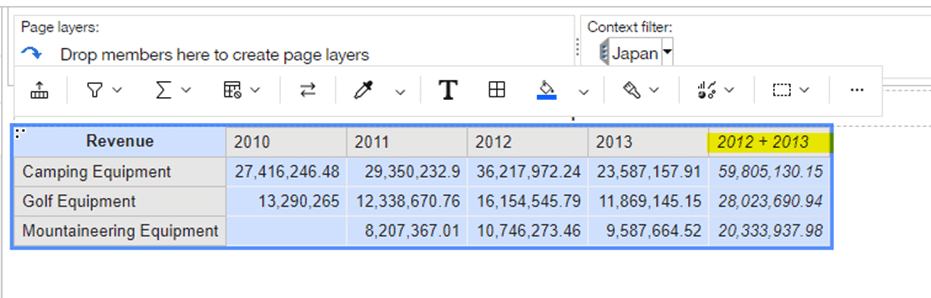
b) The next example is you may want to do some arithmetic on 2 columns… like maybe to see the total of 2012 and 2013.
i) To do this, select the 2 columns, then click the Insert calculation icon.

ii) You will get this dialog… make desired calculation selection and it will be added to the report.
Step 9 (Others – Available on the toolbar)


Swap rows and columns with this toolbar button

Apply zero suppression using this toolbar button

Include a summarization using this toolbar button

Apply sorting using this toolbar button
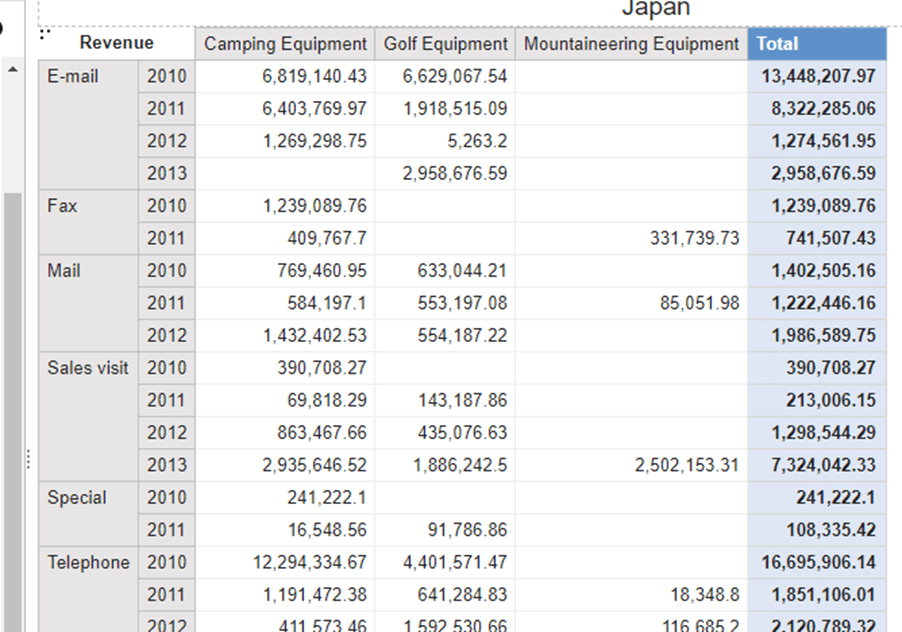
Step 10
Nesting is available just like in PowerPlay… just drag the new members that you desire to be nested onto the layout before or after the column or row members already in the report. For example, if you desired to show the Revenue by Order Type by Year, you can drag Order Type outside of the Year (after I swapped rows and columns, and added a summary column)
Conclusion
To surmise… most, if not more functionality exists in Cognos Analytics compared to PowerPlay… it just takes a bit of getting used to how to get there. I have included a GIF that shows how quickly this report is created in real-time, since looking at it in this document may seem slow and daunting:
Next Steps
We hope you found this article informative. Be sure to subscribe to our newsletter for data and analytics news, updates, and insights delivered directly to your inbox.
If you have any questions or would like PMsquare to provide guidance and support for your analytics solution, contact us today.