
Steven Nguyen, August 8, 2023
Get the Best Solution for
Your Business Today!
When developing an application, logging is a crucial part as it allows developers to gain insights into what is happening in the app and detect any potential issues early on. AWS CloudWatch is a powerful tool that provides these logging capabilities. This guide will walk you through the process of setting up CloudWatch and seeing information being logged from a Node.js application.
Table of Contents
Prerequisites
Before you begin, ensure you have the following prerequisites in place:
- An AWS account: You must have an active AWS account to access and use CloudWatch.
- Node.js and npm: Install Node.js and npm on your local development machine.
- AWS SDK for JavaScript: Install the AWS SDK for JavaScript to interact with AWS services programmatically.
- IAM User: Create an IAM user with appropriate permissions to access CloudWatch and other relevant AWS services.
Step 1: Integrate AWS SDK into the Node.js application
1. In your Node.js project directory, install the AWS SDK for JavaScript using npm:

2. Require the AWS SDK in your application:

3. Set up AWS credentials. You can provide them directly in your code, but it’s recommended to use environment variables or an external configuration file. For example:

Step 2: Set up IAM Permissions
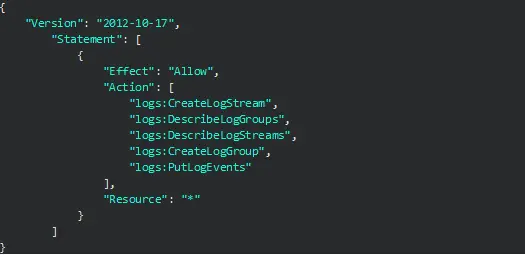
Create an IAM policy granting the necessary permissions to create and view CloudWatch Logs. Make sure the following policy is attached to the IAM user associated with your application. This can be done in the AWS IAM service:
Step 3: Integrate CloudWatch Logging into the application
1. Create an instance of the CloudWatch Logs client:

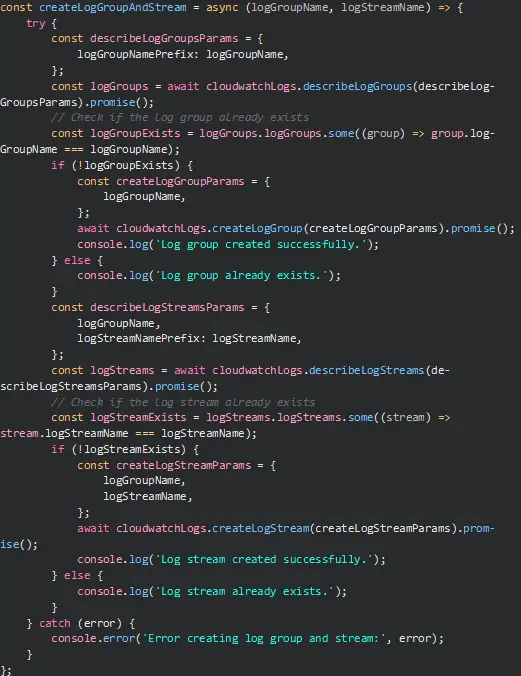
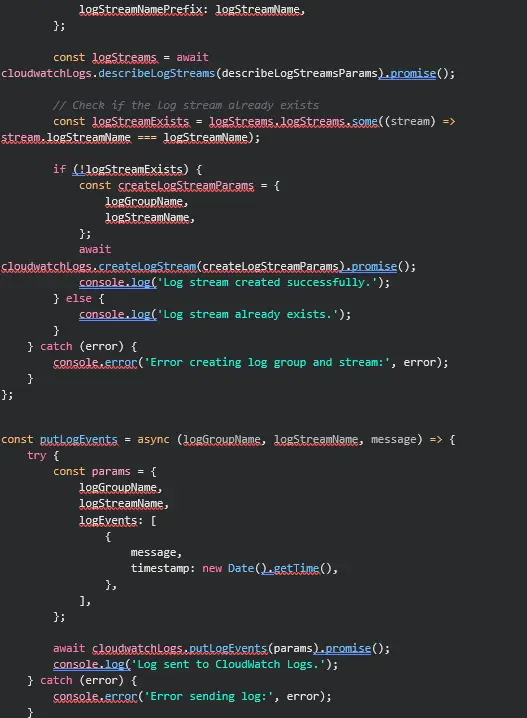
2. Define a function to create the log group and stream. You can also create these resources in the AWS CloudWatch console, but for this example we will create them within the application. Note that this route will require you to check for the existence of the resources first before creating them:
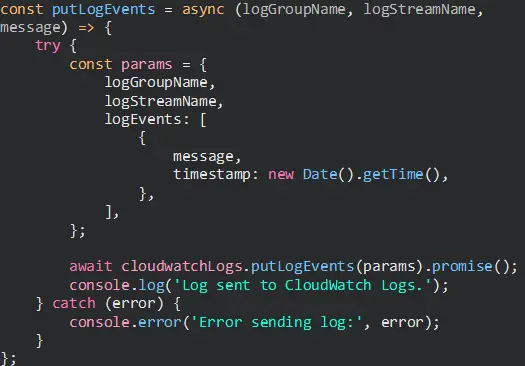
3. Define a function to send application logs to CloudWatch:
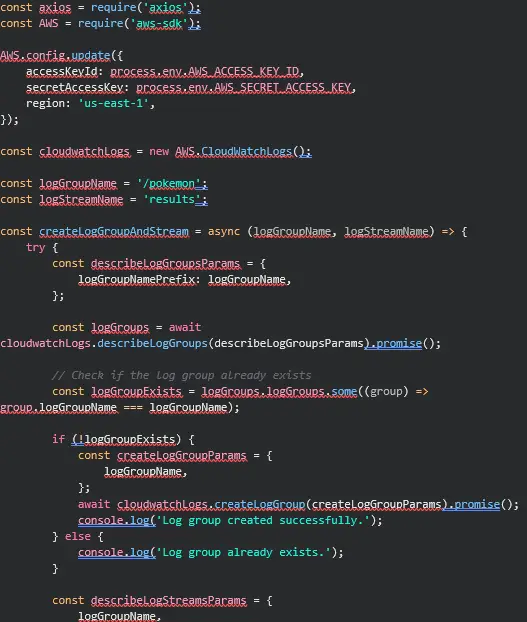
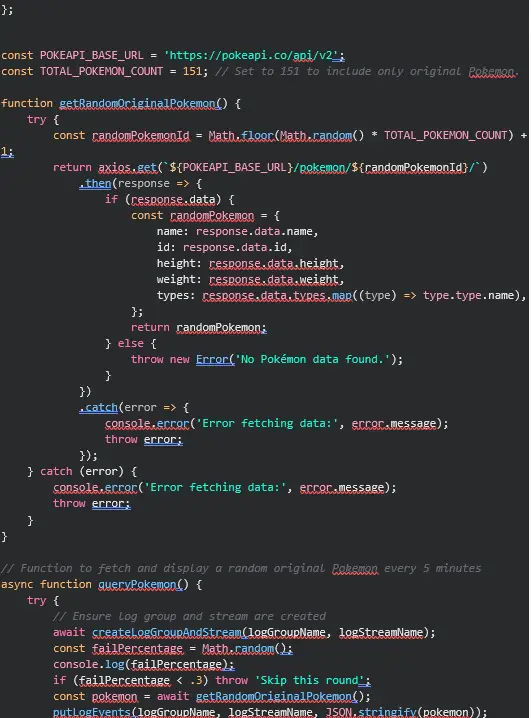
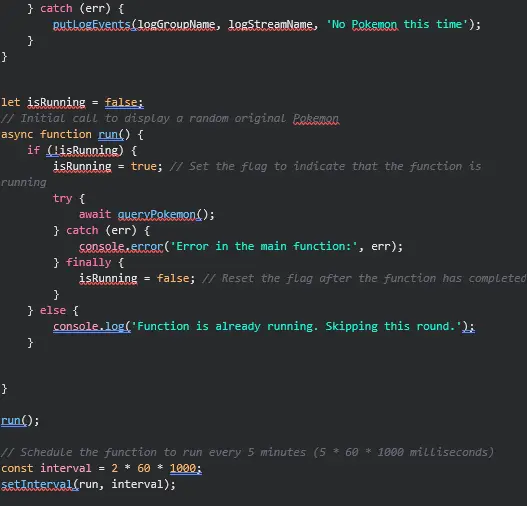
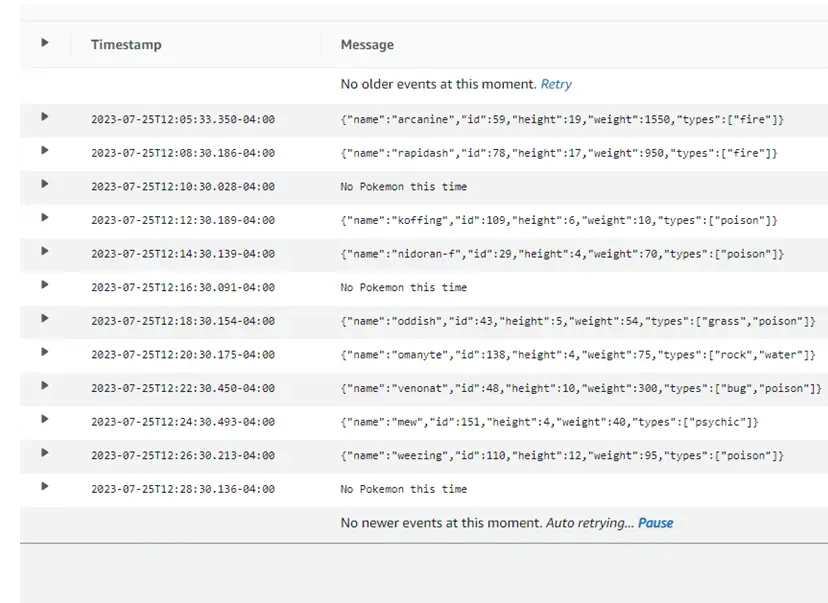
4. With the CloudWatch functions in place, its time to create an application which will utilize these functions and send logs to CloudWatch. The application we are building will call the PokeAPI to query a random pokemon every 2 minutes and log the results to CloudWatch. We will also include a 30% chance for the query to fail to simulate error logging. Below you’ll find the entire code of the application and all the CloudWatch parts put together:
Step 4: View the logs in the CloudWatch console
- Log in to your AWS Management Console.
- Navigate to the CloudWatch service from the list of available services.
- In the CloudWatch dashboard, click on “Logs” in the left navigation pane.
- Select your log group (e.g., /pokemon) from the list of log groups.
- You can now see the logs in the log stream you defined (e.g., results). Click on it to view log events.
Conclusion
Integrating CloudWatch Logging into your Node.js application empowers you to manage and analyze your logs effectively within the AWS ecosystem. By following the steps outlined in this guide, you can easily set up logging to CloudWatch, allowing you to monitor your application’s behavior, troubleshoot issues, and gain valuable insights into its performance. The example provided in this guide only scratches the surface of what you can achieve with the service. You can easily build upon this example to match any specific needs. Now, you’re equipped with a powerful logging solution to enhance the observability of your Node.js applications.
Next Steps
We hope you found this article to be both informative and helpful in the integration of CloudWatch Logging. If you have any questions regarding your cloud solution, or would like PMsquare’s guidance in your cloud integration, contact us today.


