Sonya Fournier, February 6, 2020
Get the Best Solution for
Your Business Today!
Table of Contents
More Power
When Cognos 11.1 was released, it introduced enough new Data Modules features that a realistic case could be made to consider moving from Framework Manager packages to Data Modules for metadata modeling. One of the essential pieces that were missing from earlier releases was the ability to deal with multi-grain issues (as addressed by determinants in Framework Manager).
Without determinants, we can end up with double-counting or incorrect aggregation in our reports and dashboards. Until some sort of feature was added to deal with multi-grain data scenarios, it was impossible to fully move to Data Modules when reporting against a data warehouse.
In Data Modules, we don’t have determinants, which isn’t a bad thing as they were always a bit hard to comprehend as implemented in Framework Manager. Instead, we have something called “column dependencies”. We use column dependencies in a couple of scenarios:
1. When we see multiple fact tables with conformed dimensions joined to dimensions on columns that are at different grains of detail.
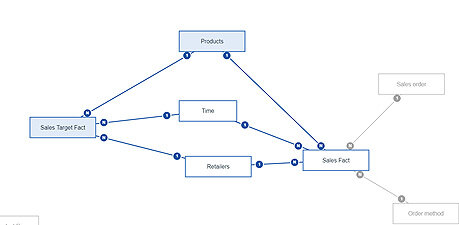
As an example, Sales target fact and Sales fact join to conformed dimensions on different fields – Sales target joins on the month field in the Time table, Sales target joins to Products table on Product type, and Sales target joins to Retailers table on Retailer table whereas Sales fact joins on Date, Product, and Retailer site (all at a lower grain of detail).

2. When a table contains data that is pre-aggregated.
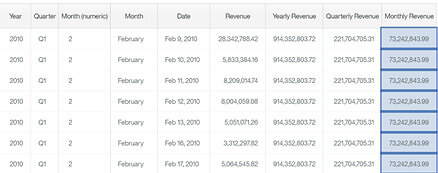
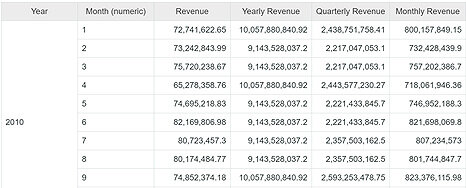
For example, a table that contains pre-summed columns for revenue at the monthly, quarterly, and yearly levels. If we add those pre-summed columns to a report, Cognos is likely to aggregate them again.
Adding Column Dependencies to Multi-Fact Data Modules
When tackling the first issue above, we need to add column dependencies to each of the conformed dimensions.
A closer look
Let’s look at the model first before we add column dependencies. We have the following joins defined:
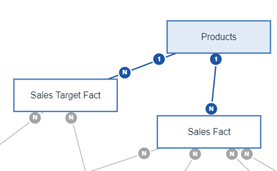
“Products” joins to “Sales Fact” on “Product Key”. This is the lowest grain of detail in the database (the “Atomic Grain” as Kimball would say).
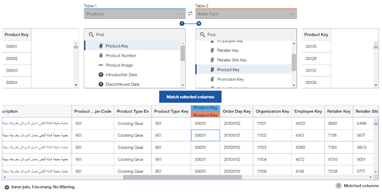
When we look at the relationship between Sales Target and Products, we can see that it joins on a higher grain (Product type key).
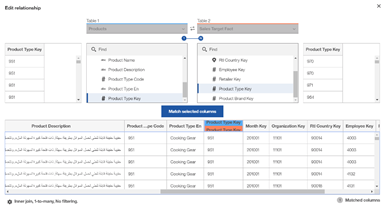
This is not the lowest grain in the Products table so we will see repeating values if we include information from both fact tables in our report.
Here is an example of the data in a report:
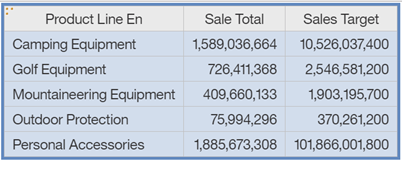
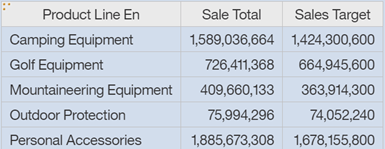
In this example, our Sales Target is much higher than our Sales Total. If we add more information to the report, we can see from where these numbers are derived.
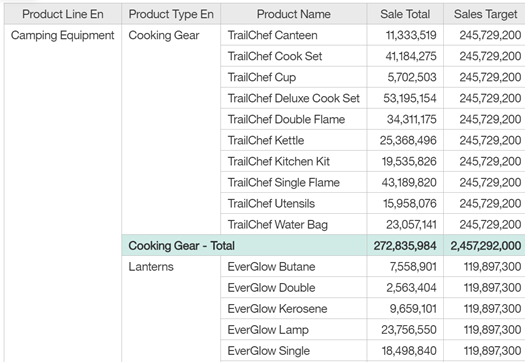
Since we don’t have a Sales Target for every product—rather by Product Type—we are seeing the Sales Target repeat for every product. Because Cognos Analytics will sum these values by default, we see incorrect data when we only include Product line, Sales total, and Sales target. Even with more detail, we will see incorrect subtotal values.
The fix is in
How can we fix this? We can add column dependencies in the data module.
To do this, we go to each conformed dimension (each dimension that sits between two fact tables) and go to the Column dependencies screen.
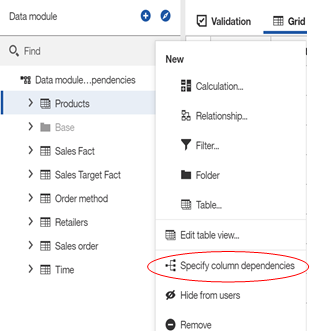
We start here with a clean slate.
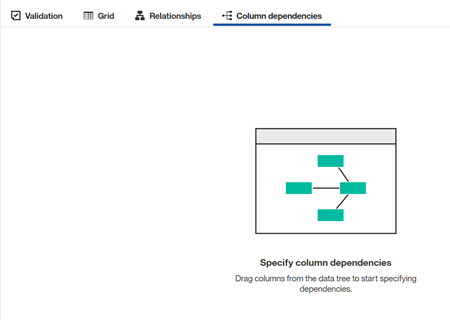
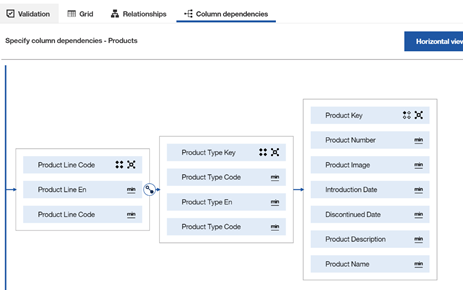
From the Products table, we drag over the columns that represent the different groupings of data we have on this query – so on the product table, we have three major levels or groupings of data: product line, product type, and product.
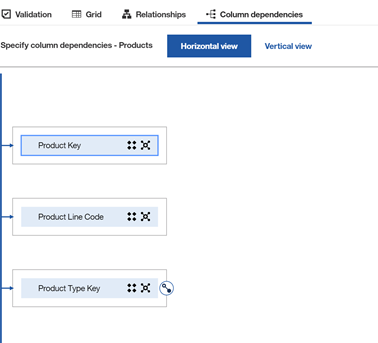
You should choose the key or code columns here whenever possible (or the fields that are used for the joins).
We need to link these dependencies in order of coarsest grain to most fine. To do this, we start with product line and drag the connection icon on top of product type. Do the same from product type to product.
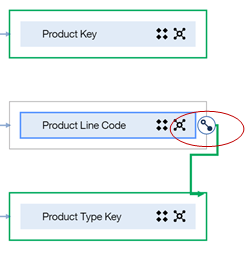
Next you add all of the columns that are at the same grain as your initial columns:
We repeat this process with the other conformed dimensions.
If we test our report again, here is what we will see:
If we add more details:
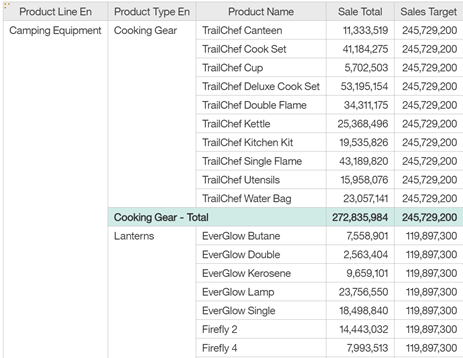
You can see the data is still being repeated (the only option since Cognos does not know how that product type sales target could be divided by product) but when we look at the summary column, it is showing the correct value.
Adding Column Dependencies to Tables with Pre-Aggregated Data
The second type of column dependency is needed when you have pre-aggregated measures in your table.
When we are setting up column dependencies in this situation, we will add the measures to the group level to which they are aggregated. For example, we will add Yearly Revenue to the Year column dependency.
Here is the data module we are working with:
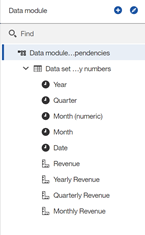
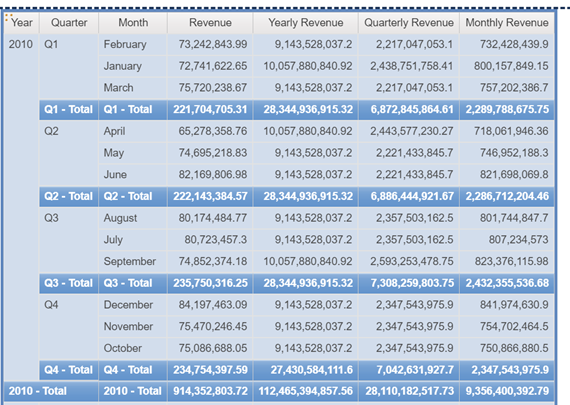
When we build a report using this data module, we see that both the details for Yearly, Quarterly, and Monthly revenue are incorrect and that the subtotals are also incorrect. In the example below, we should see the same value in the Monthly Revenue column that we see in the Revenue column.
When we add column dependencies, we start with adding the level groups.
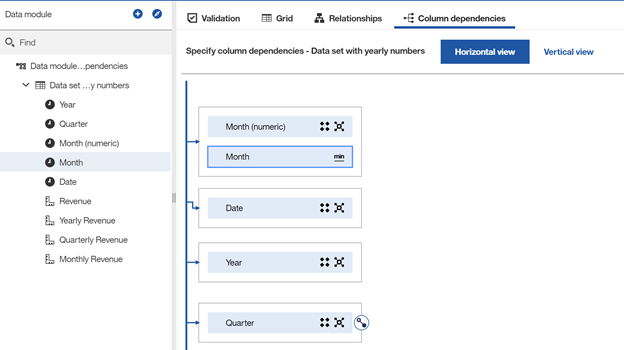
Then we will link each column dependency from coarsest grain to most detailed grain.

Then we add the measures to the appropriate grain.

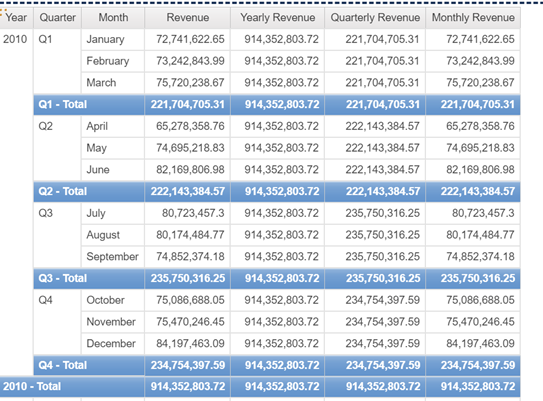
When we retest the data module in the reporting tool, here is what we see now:
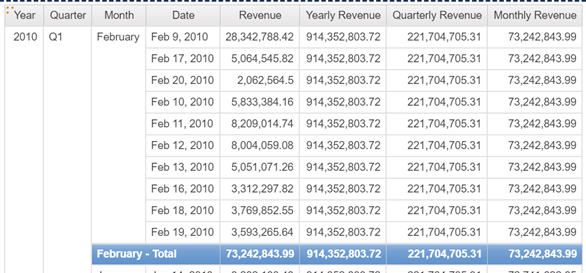
If we add Date to the report, we can see all the values.
Conclusion
With the addition of column dependencies, it is starting to get easier to see how we can start transitioning from Framework Manager models to Data Modules. Will you start moving new development to Data Modules? Or are you Framework Manager for life?
Next Steps
We hope you found this article informative. Be sure to subscribe to our newsletter for data and analytics news, updates, and insights delivered directly to your inbox.
If you have any questions or would like PMsquare to provide guidance and support for your analytics solution, contact us today.


