

Share


Joseph Cozzi, September 1, 2025
Get the Best Solution for
Your Business Today!
Local caching, also called browser-side caching, is a feature of Cognos Dashboards that increases the speed of fetching data and allows for a more consistent experience. As the name suggests, a local cache stores data in the browser on the machine where the dashboard is being created. This means that Cognos no longer has to travel all the way back to the data source to grab data when changes are made to the dashboard. This can make a huge difference in server environments that contain high amounts of traffic and bandwidth is limited. In a situation with limited bandwidth, a change in the dashboard such as a filter could take a few seconds or up to a minute to populate with data. However, with the local caching feature you can load all the columns you are going to work with on to your browser and make changes as you please without interruptions.
As an end user of a dashboard, having the correct configuration of local caching set up means that Cognos will use the local cache in tandem with the server-side cache to provide improved performance. As you apply and change filters to the dashboard you will see this effect. The dashboard developer can help you achieve this by adding columns that you will filter, or columns you will use as a filter to the local cache. Once the cache (or caches) has been set up, the relevant query data will be stored on your browser for easy access. You may notice some improvements to load times with your dashboard, but local caches function smoothly in the background. So, if they are set up correctly you should not even notice that they are there. Again, make sure that the local caches are configured with columns that you use for filtering the dashboard. There are some limitations to the size of the cache. To help the dashboard developer create local caches for you to use, let them know any relevant restrictions you have for the data you need to view. For example, you may only need to view transaction data for the past year. If so, the developer can filter the data and reduce the size of the cache for further optimization. There is a hard limit of 300,000 rows. Any more than that and Cognos will not create a local cache to save memory space on your browser.
Here is an additional list of limitations pulled from Cognos Documentation:
- Crosstab visualizations where null suppression is turned on
- Crosstab visualizations where summary rows and columns are shown
- Top or bottom filters
- Navigation paths
- Model Filters and Parameters
- Insights/Forecasting
- Tables with Ranks applied
- Cognos Explorations/Stories
- Tables with Average summaries
- Count distinct aggregation type
- Grouping
- Widgets and visualizations that are set to automatically refresh
It is also important to keep in mind that local caching is not ideal for situations where data needs to be constantly updated to stay up-to-date.
The benefits of local caching become more apparent with more complex queries and in situations with high network traffic. In situations with low traffic, you may not even notice the difference as the load time will likely only be a few milliseconds lower. However, the point of local caching is to maintain consistent load times. For example, if there are traffic spikes in your network, you will not experience them if you are using local caching. This allows you to stay in a consistent workflow as you decide how you want to view your data through filters or drilldowns, or as a developer, which columns you want to use in your visualizations or which visualizations you want to use for your dashboard. With the configuration options a developer can adjust the caches to only contain the columns you are working with to free up memory on your machine.
Now, I’ll switch over to the developer’s perspective and explain how these local caches can be configured. As an end user, this section can help you better understand the capabilities of local caching and can help you when it comes time to communicate your needs to the dashboard developer. By default, local caching is set to auto-generate upon saving. But there are ways to control this feature. There are two locations in the dashboard environment where the user can interact with the local caching feature. The first is in the action bar. You’ll see that if you select a visualization, one of the icons that appears on the action bar is a lightning bolt. Click on the lightning bolt icon to generate a local cache for the selected visualization. The other location is in the advanced dashboard properties. To access this, make sure no visualizations are selected and open up the properties menu of the dashboard. Scroll to the bottom of the properties panel and open the ‘Advanced’ section.
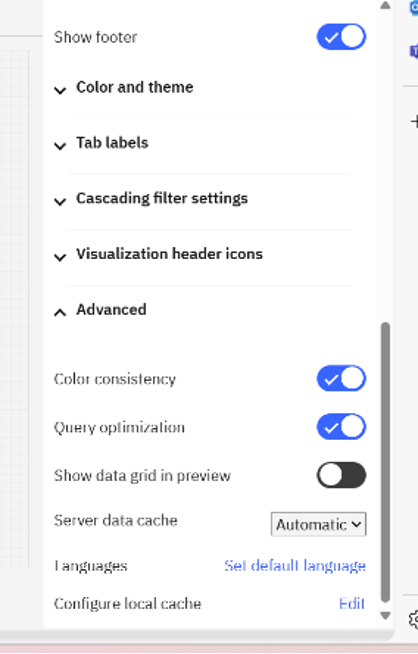
At the bottom of the ‘Advanced’ section click ‘Edit’ next to ‘Configure Local Cache.’ Going down the list; you can toggle the option to auto-generate on save, search for caches based on columns they contain, sort caches, and view generated caches.
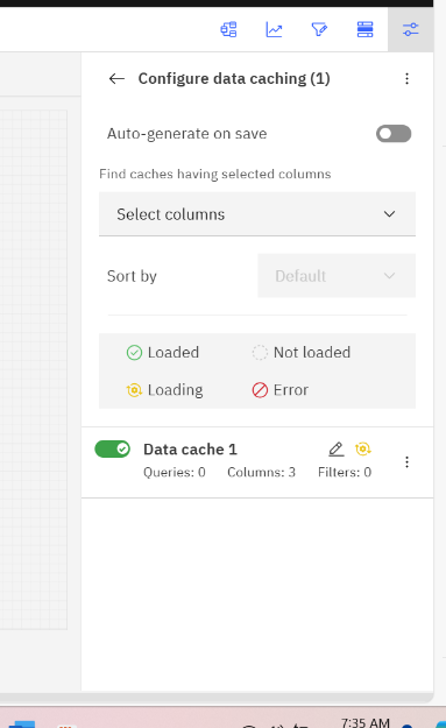
In the cache viewing section of the menu, you can toggle whether an individual cache is active or inactive and rename the cache. Clicking the three dots next to a cache allows you to reload, duplicate or delete the associated cache. Clicking directly on the title of a cache brings up additional information on the cache including columns present in the cache and visualizations associated with the cache. From here you can add filters on columns to reduce the amount of data pulled into the cache if needed.
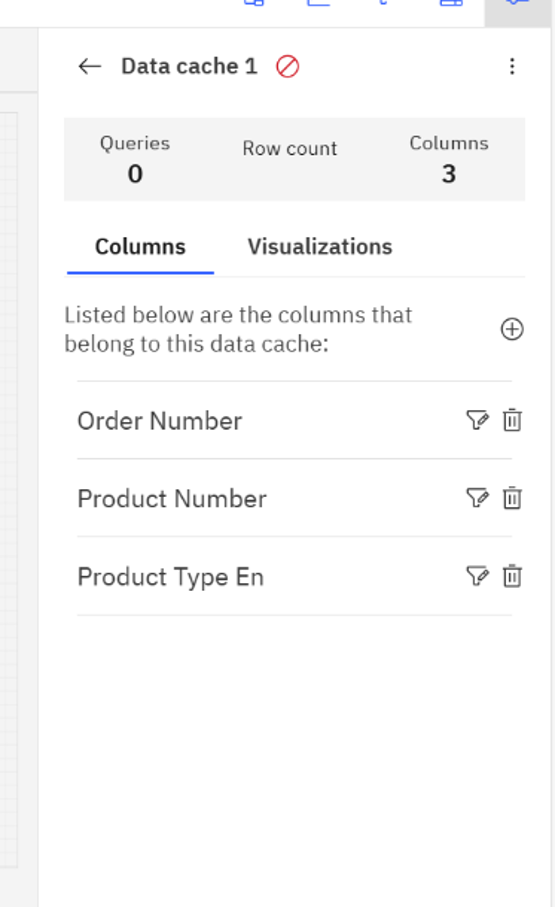
As you can see from the red error symbol, this cache is too large in its current configuration. In order to get this cache up and running some filters will need to be applied to the columns.
To summarize, local caching improves user experience by improving the consistency of the data in a dashboard. While you can configure it to your liking, its power comes from not having to worry about it after it is set up. It works quietly in the background as you go about your dashboard creation or viewing.
Next Steps
We hope this article was insightful and gave you a better understanding of Local Caching in Cognos. If you have any questions or need support in optimizing your Cognos dashboards, don’t hesitate to reach out to PMsquare today.
To stay informed about Cognos Analytics trends, best practices, and technical insights, consider subscribing to our newsletter.