

Share


Dan Swan, September 16, 2024
Get the Best Solution for
Your Business Today!
What’s New in PAW Series
- New Features in Applications and Plans (read here)
- New Features in Books and Reporting (You are Here)
- Watch the Books and Reporting corresponding video on YouTube
- New Features in Modeling (Read here)
Notes:
This article covers the updates to Books and Reporting released in 2024 as of August 2024.
Examples shown here use the Smartco sample model provided by IBM.
Table of Contents
A Book Now Retains Formatting when Saved as a Template
Release 2.0.93 – February 20, 2024
When you save a book as a template, any data formatting applied to an entire view or visualization is preserved in the template. When you create a new book from this template, the retained formatting automatically applies to the view or visualization including data formatting.
Use the New Advanced Selector Widget to Synchronize Members
Release 2.0.93 – February 20, 2024
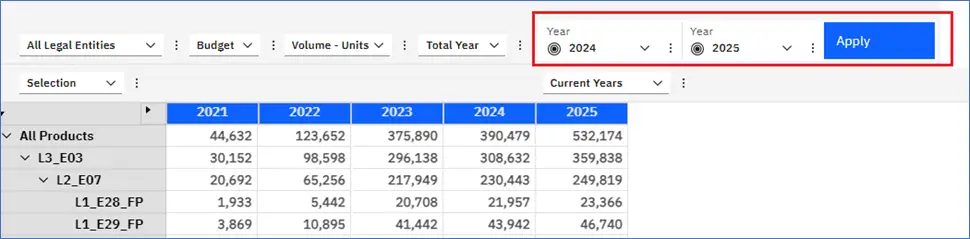
Use the new Advanced selector widget to create a one-way synchronization using multiple selectors. The multiple selectors use the same hierarchy giving a user the ability to pick individual members or a range of members.
One-way synchronization means that changes can be applied by the Advanced selector widget, but the changes can be subsequently overridden by changing a filter on a dimension. For example, below the Advanced selector widget was applied to the Years dimension to show only 2024 and 2025, then the Current Years set was chosen, which overrides the selector. The selector (highlighted) does not synchronize and remains unaffected by the Current Years set selection.
You can click Undo at any time to reverse a selection change.
To Add an Advanced Selector Widget
Add an Advanced selector widget from an exploration column, row, or context area, but not from benched dimensions.
Go into “Edit mode.”
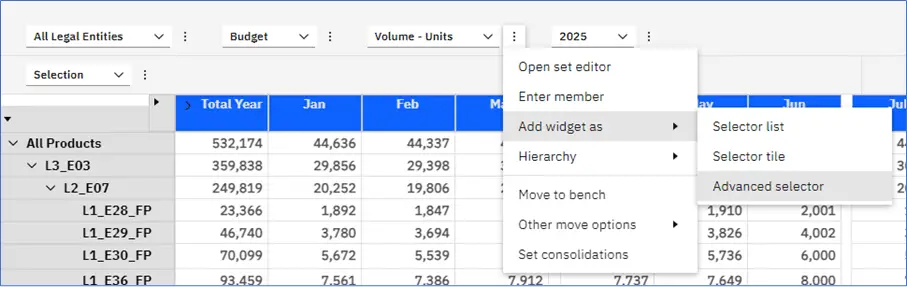
Click the menu icon to the right of the dimension from which you want to create an advanced selector widget.
Go to “Add widget as”, then select “Advanced selector.”
The advanced selector widget will appear at the bottom of the tab. Move the selector widget anywhere on the canvas.
Customize how the widget appears, its layout, and member selection methods. You can also choose when changes apply to the synchronization group.
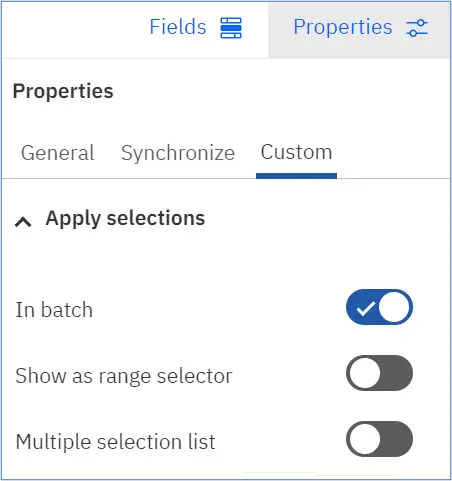
With the widget highlighted, click on “Properties” and go to the “Custom” tab.
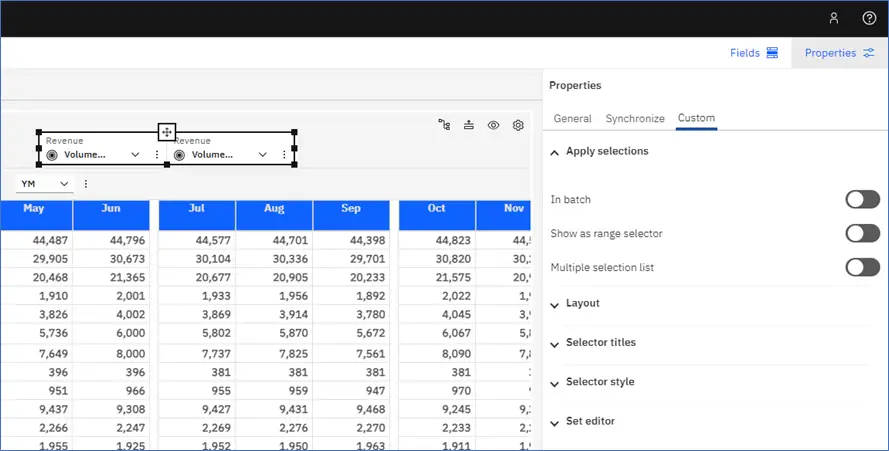
Apply Selections
Within the Apply selections section, you can control how the selection is applied to the synchronization group.
Enable the “In Batch” property to ‘batch’ your selection changes. When the “In Batch” property is enabled, an “Apply” button appears to the right of the selector widget.
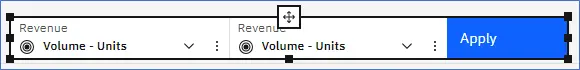
This property allows you to apply changes when you want, else if this property is not enabled, any changes are applied to the synchronization group immediately.
Below, “In batch” is enabled.
Enable “Show as range selector” to view a range of members in a dimension. In the example below, the two selectors show 2020 and 2024 respectively and view changes to show that range of years in the columns.
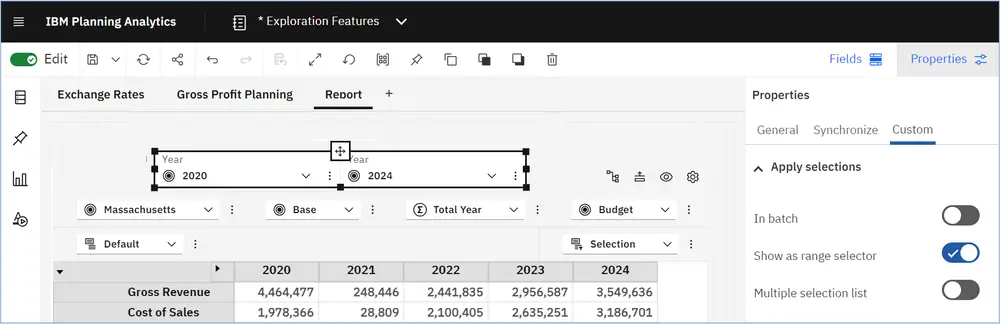
Note: You can only have a maximum of two selectors in the Advanced Selector for the Show as range selector property to work.
With “Multiple selection list” enabled, the Advanced widget converts to a list based on the first selector and it’s current member selection.
You can select one member, or use Ctrl-click to select multiple members from this list.
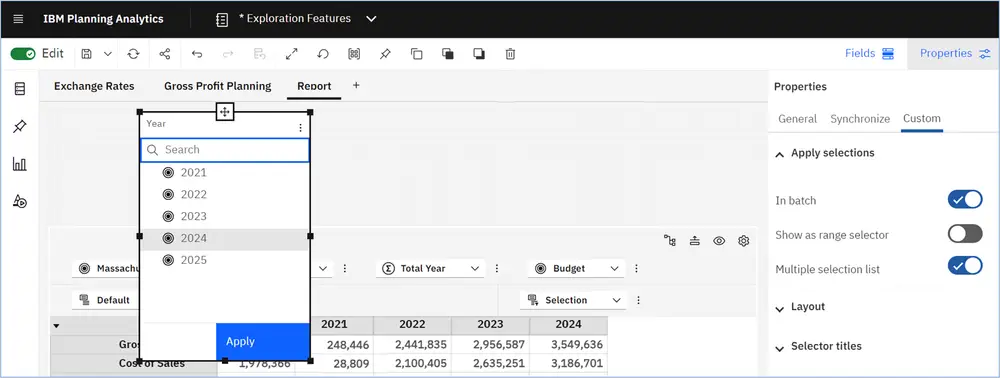
Note: You will need to also enable the “In batch” property when using the “Multiple selection list” so that changes apply only after all the selections are made.
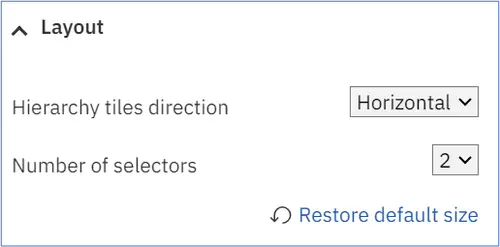
By default, Advanced selector widgets contain two selectors. You can also choose to add up to four selectors to display in an Advanced selector widget.
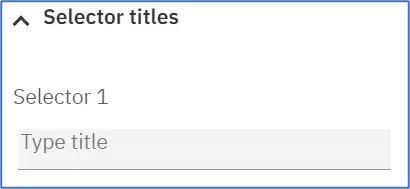
Selector titles – Enter the title for each selector in the Advanced selector widget.
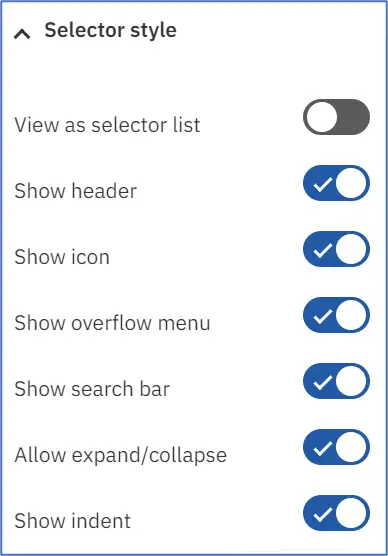
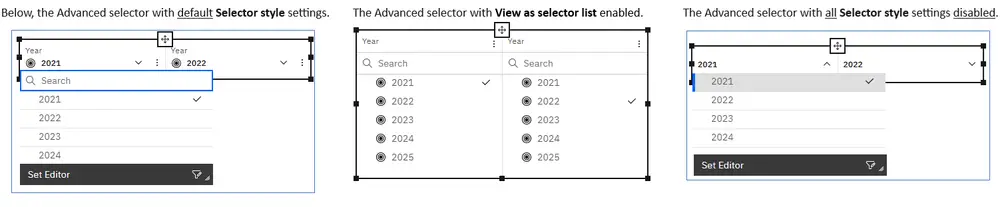
Selector style – Within the Selector style section, you can display the Advanced selector widget as a simple list, expand and collapse the widget, show the search bar, and much more.

Set editor – disable the Set editor to prevent users from using it within the Advanced selector.
- View as selector list – disabled by default, enable this to convert the selector to list all available members
- Show header – enabled by default, disable to remove the hierarchy name.
- Show icon – enabled by default, disable to remove the icon.
- Show overflow menu – disable to remove the three-dot overflow menu icon.
- Show search bar – disable to remove the search option.
- Allow expand/collapse – disable to prevent users from expanding and collapsing a hierarchy.
- Show ident – disable to remove indentation within a member list.
Fields Panel for Explorations
Release 2.0.94 – March 20, 2024
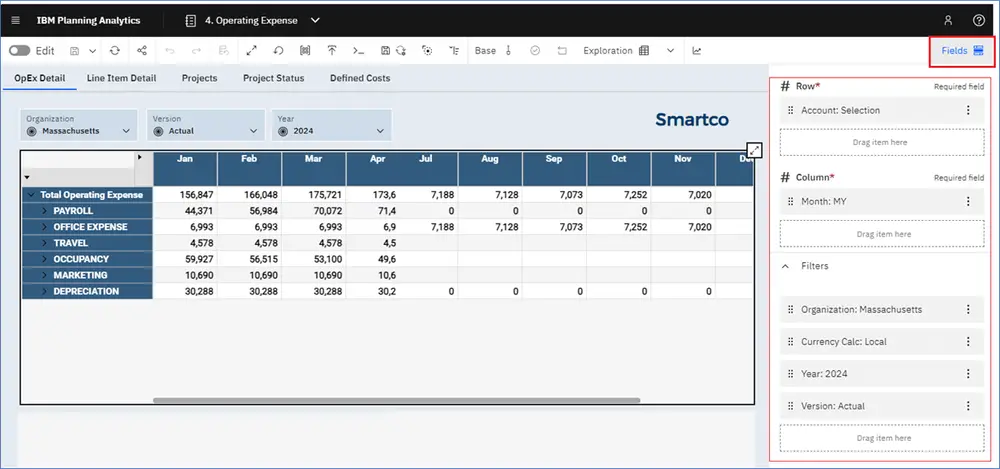
A Fields panel has been added to manage settings in Explorations within Books.
The actions that you can perform in the Overview area of an exploration are supported in the Fields panel, except Move to bench.
Select an exploration and click on Fields to open the fields settings.
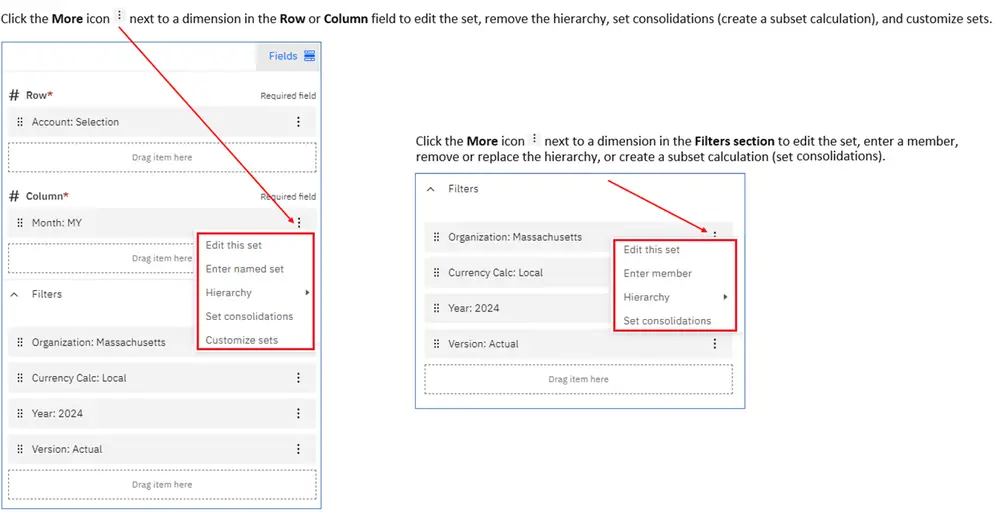
Dimensions in the Context area of the exploration appear under “Filters” in the Fields panel. You can drag dimensions from “Filters” to the “Row” and “Column” fields.
New Format Manager to Format Cube Views
Release 2.0.94 – March 20, 2024
Cube viewer formatting options are now consolidated into the new Format manager in workspace.
The new Format manager contains the formatting options that were under “Format values” in the toolbar, the cube view menus that controlled Formats, Cell Alignment, Member alignment and Conditional formatting. Also, the Format manager contains the formatting options that were in “Visualization properties” which included formatting for Data cells and for row and column header sections.
You can apply and manage formats for a “view” and “members” in the current view:
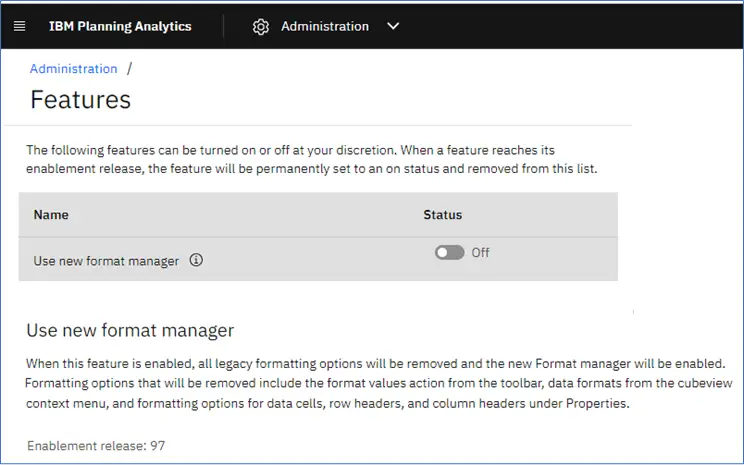
Important: The new Format manager is must be enabled by a Planning Analytics Workspace administrator. If an administrator does not explicitly enable the new Format manager feature, all cube viewer formatting options remain in their existing locations until the feature becomes permanently enabled in a future release (the enablement release).
Accessing the Format Manager
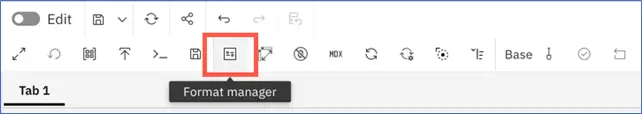
Access the Format manager from the cube view toolbar using the old Format values icon.
The Format values icon was re-purposed for the Format manager in this release.
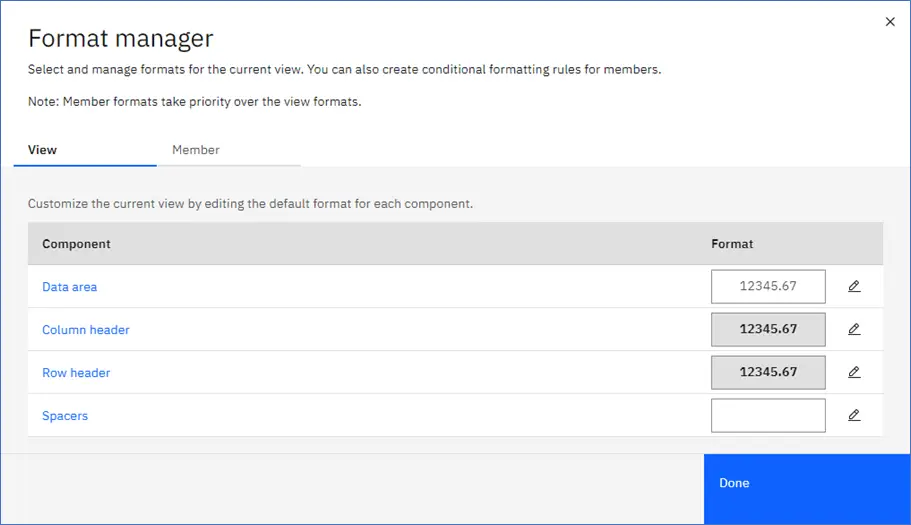
The new Format Manager window showing the View section for formatting a view.
View
- Cell color for data cells, row headers, and column headers
- Data formats for data cells
- Font and string formats for data cells, row headers, and column headers
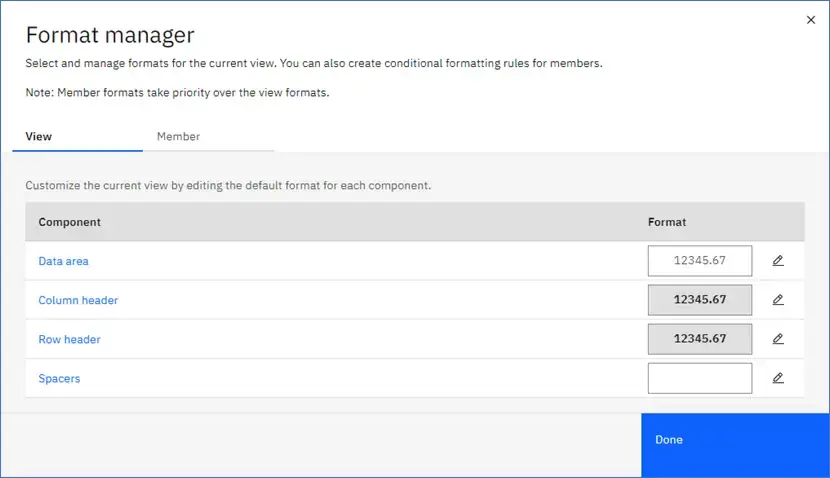
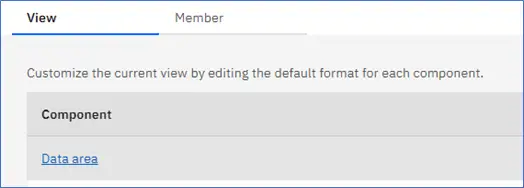
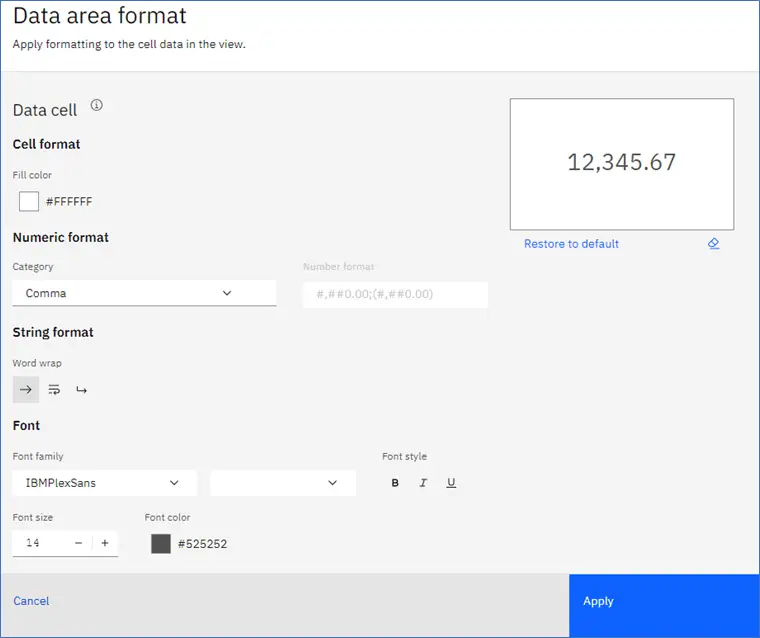
Click Data area to change formatting for cell values.
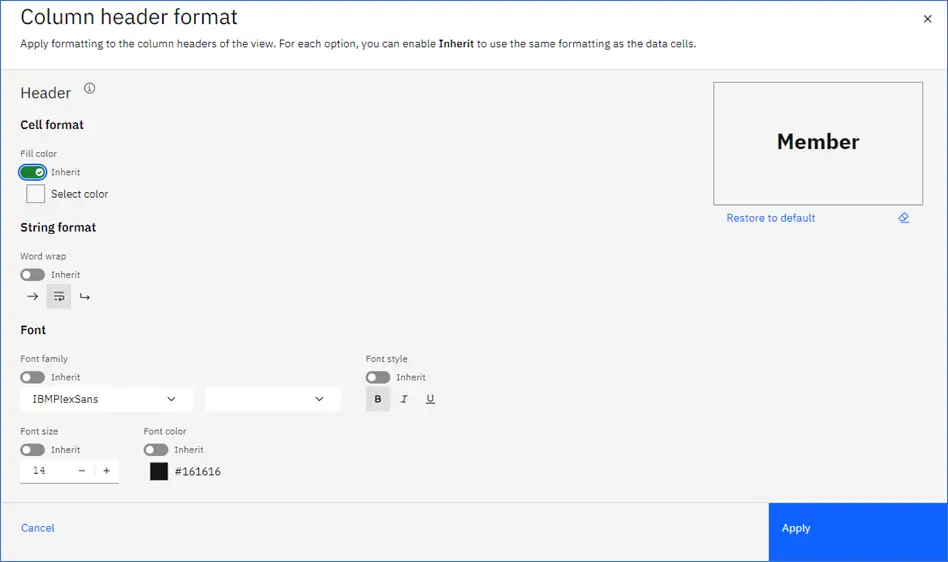
The Column and Row header format windows both offer the same options.
You can select to inherit formatting from data cells and apply it to row or column headers when formatting a view.
Member Formatting
Note: You can inherit view formats and apply them to the member data or header cells.
Right-click a member in the view and select “Member format” to jump right into the member formatting options.
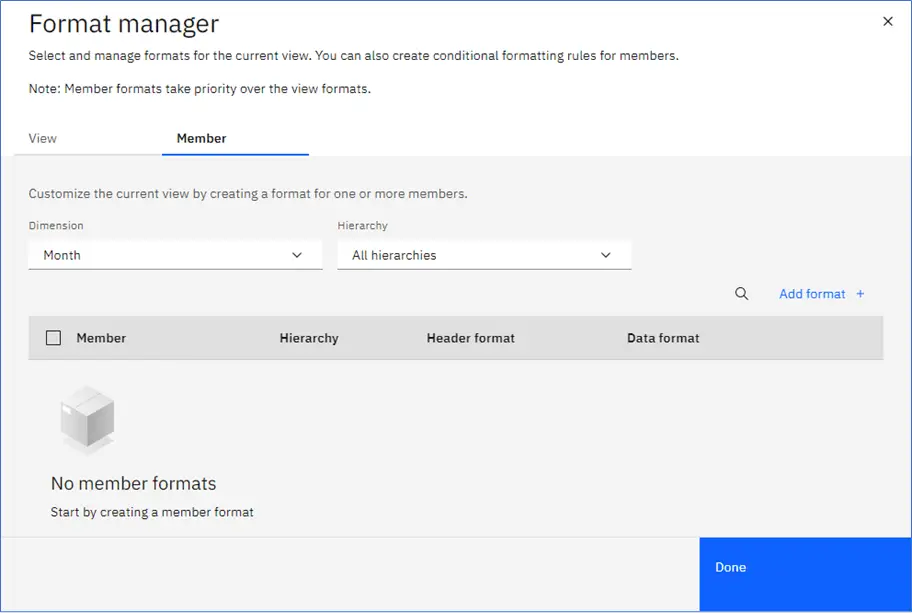
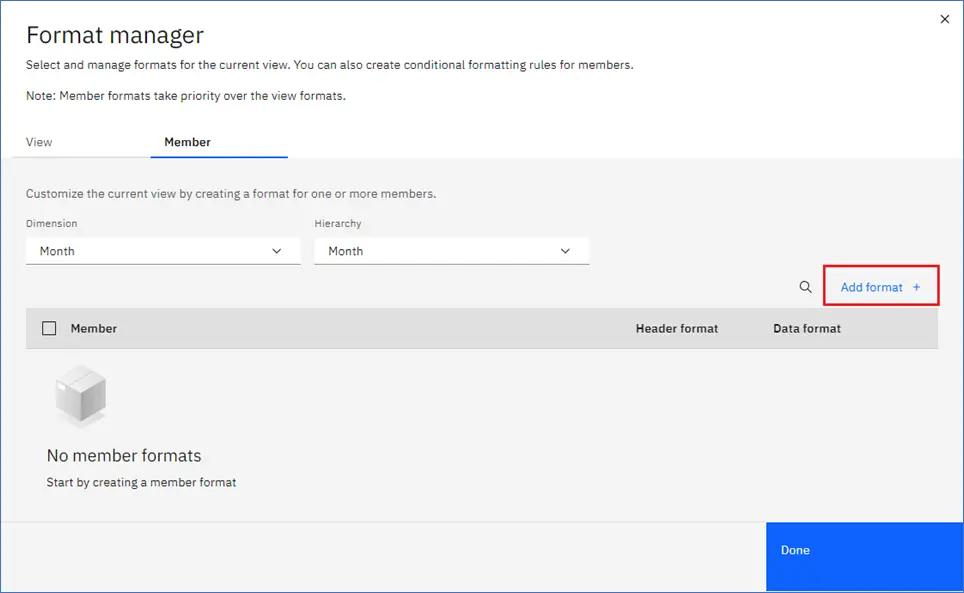
Below, the Month dimension and the Month hierarchy has been selected. Click “Add format” to select a dimension member to apply formatting.
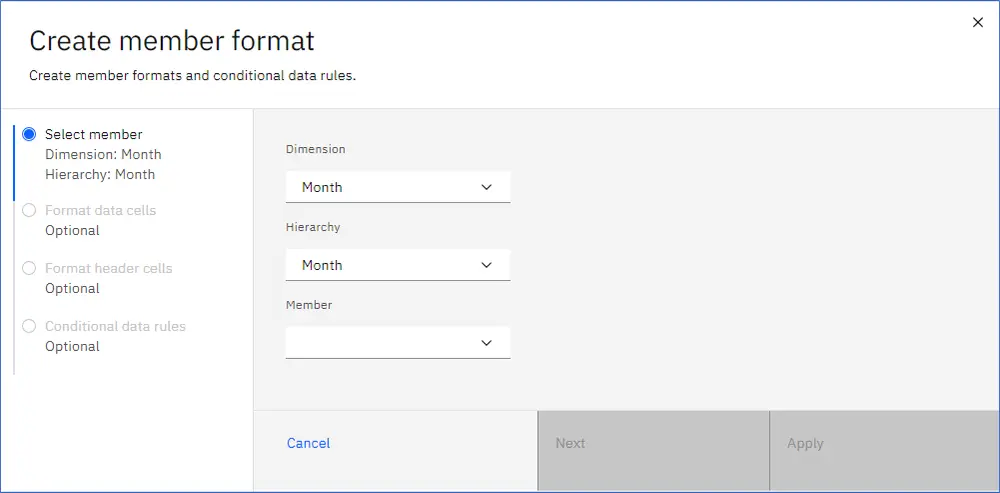
Select the member to apply formatting.
With a member selected, the Options become active and the member selection is noted.
Choose to format data cells and/or header cells.
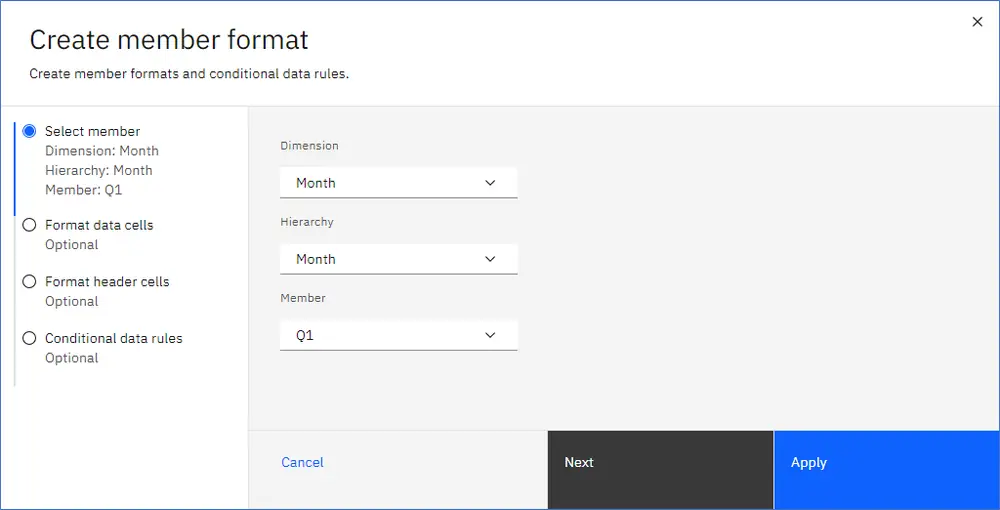
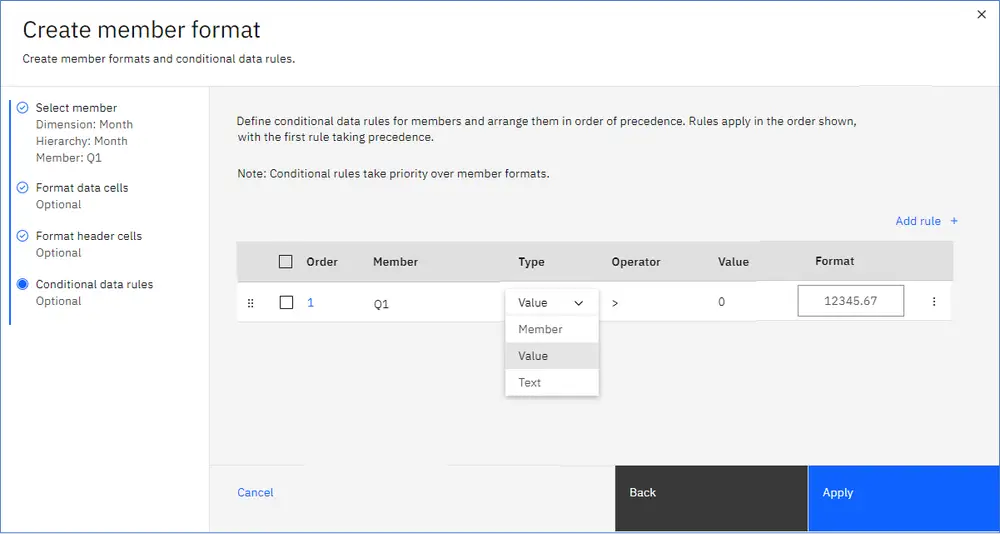
Click “Add rule” to create a conditional rule for selected members.
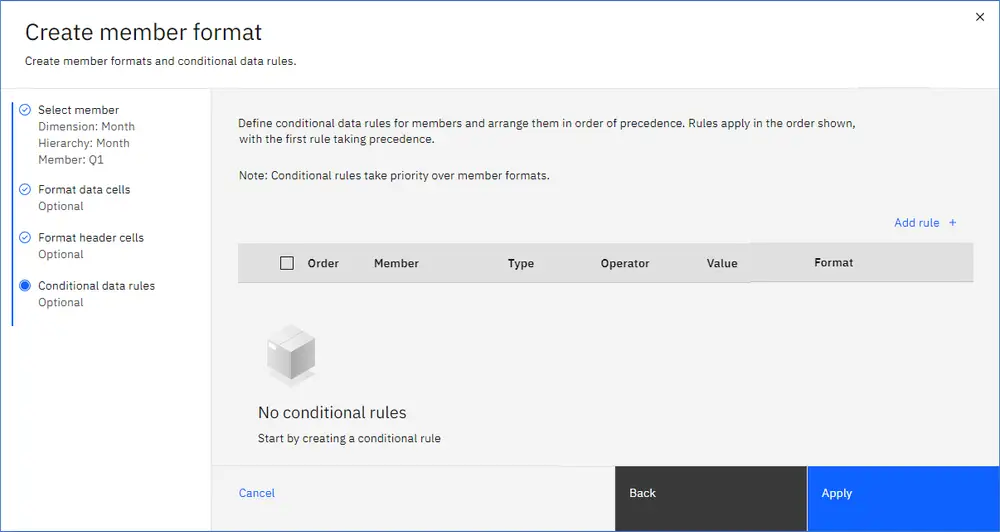
Set a conditional rule for the selected member and then choose Type, Operator and Value. Click “Apply” when complete.
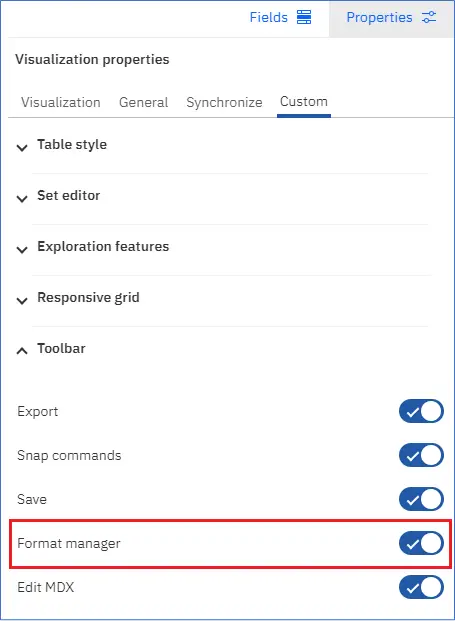
You can add or remove Format manager from the toolbar. In Edit mode, go to the “Visualization Properties,” “Custom tab” and open “Toolbar” icon settings, as shown below. By default, Format manager is enabled. Disable if you want to block users from seeing the Format manager icon in the toolbar.
Note: You cannot remove applied formatting using the right-click menu anymore. Instead, use Format manager or Member format to clear or change formats.
Create Multivariate Forecasts
Release 2.0.94 – March 20, 2024
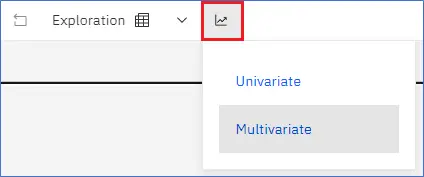
Both univariate and multivariate forecasts are now available in Planning Analytics Workspace.
The univariate forecast predicts future values using a single variable based on historical data, using the Holt-Winters model.
The multivariate forecast is a type of forecast that considers multiple time-dependent variables. This approach looks not only at historical data, but also accounts for the interdependencies and relationships among the specified variables to create a forecast. The specified variables perform an important role in determining forecast results, so it’s important to choose variables that are highly correlated with your historical data.
Multivariate forecasting uses one of two models depending on the number of historical data points and whether future values are included in the forecast. The vector auto-regressive (VAR) model is used if there are less than 64 data points in the historical data. The auto-regressive integrated moving average (ARIMAX) model is used if future values are included in the forecast. If there are more than 63 historical data points and no future values are included in the forecast, then the system chooses the optimal model. The option to include or exclude future values are available when you configure the forecast.
Both multivariate models (VAR and ARIMAX) are not seasonal, so if your data is highly seasonal, use the univariate forecasting method.
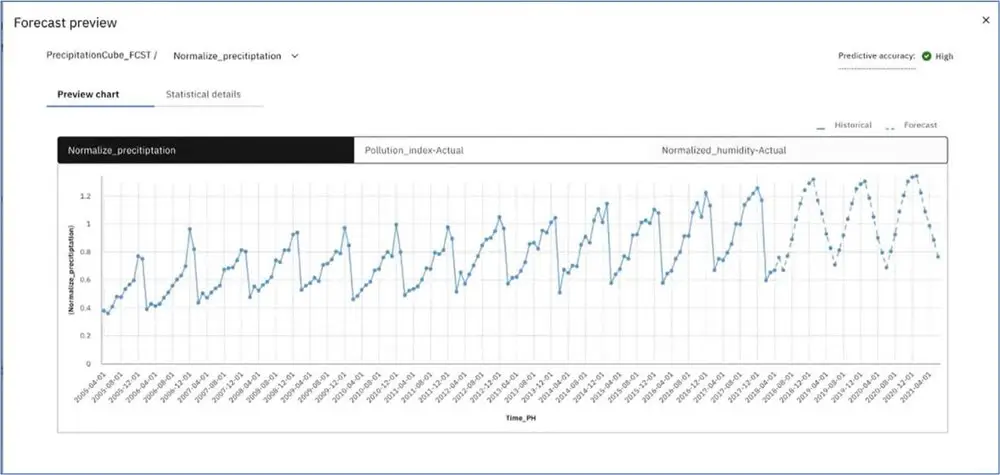
When you generate preview and generate a multivariate forecast, a visualization is created for the targeted forecast area and visualizations for each variable that contributed to the forecast. The visualizations created from the variables help illustrated how the variables affected the outcome of the target forecast.
Multivariate Forecast Requirements
- Time Dimension – must be a contiguous, evenly spaced set of time periods organized in order of increasing time. The time dimensions must be placed in the columns of a view. Multiple time dimensions can be nested.
- Historical Data – at least 16 historical data points are required and seasonality does not apply.
- Forecast Data Cells – forecasted time periods must exist and also be contiguous – the system will not create new time periods. The forecast will fail if any of the forecasted cells contain a calculation.
- Version Dimension – if you use a version dimension, it must appear in the context area of the exploration view, else it is not available as a target on the “Advanced” tab when you set up your forecast.
- Variables – variables can be selected from different cubes, but the variables must exist in a cube that uses the same time dimension as the view used to initiate the forecast. The cube for the variables must also reside within the same database as the view used to initiate the forecast.
These are the basic forecasting requirements. Go to Forecasting requirements for a comprehensive explanation of requirements for univariate and multivariate forecasting methods.
New Synchronization Settings for Hierarchies
Release 2.0.95 – April 23, 2024
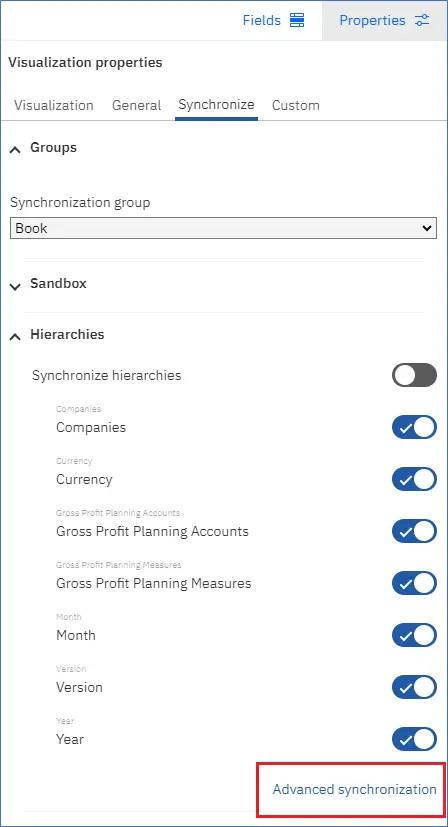
The latest synchronization settings are found in the “Visualization Properties” within the “Synchronize tab” and then under the “Hierarchies” section.
Advanced synchronization will allow you to customize how each hierarchy in the cube viewer or visualization displays when a synchronization event is received by that widget.
Note: The advanced synchronization settings apply to only the widget that receives the synchronization event.
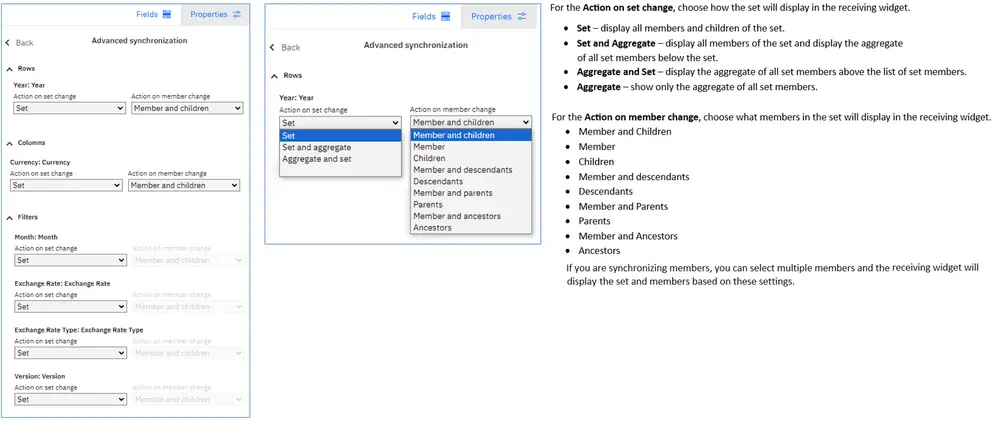
The Advanced synchronization panel is separated into “Row,” “Column,” and “Filters” sections.
On the “Row” and “Column” areas select what each hierarchy displays when the widget receives a set or member change.
Under “Filters” you can select the hierarchy in the Context area.
You can move a hierarchy to a different area of the widget and the advanced synchronization settings will persist.
Use Unnamed Members in Set Consolidations
Release 2.0.96 – May 28, 2024
Set Consolidations can now include named and unnamed set members. Set Consolidations used to be called Subset Calculation Options.
You can create a set consolidation from multiple places in the application:
- From the dimension tile overflow menu (shown in the “Create a Set Consolidation” example below)
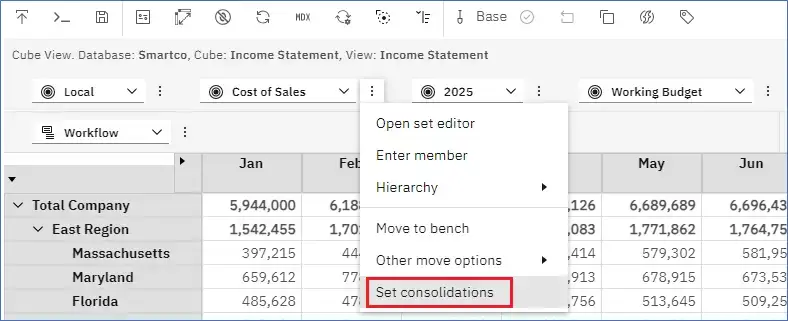
- Right-click on a column or row member header and the Set Consolidation option will appear near the bottom of the menu
- Right-click on the thumbs right-click menu
- From the Fields panel tile menus
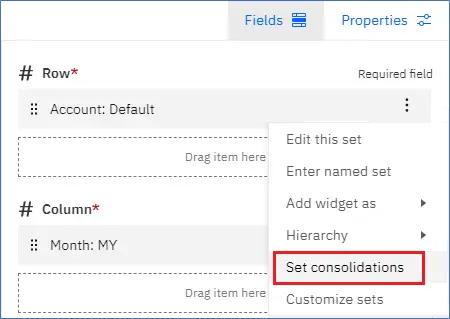
Create a Set Consolidation
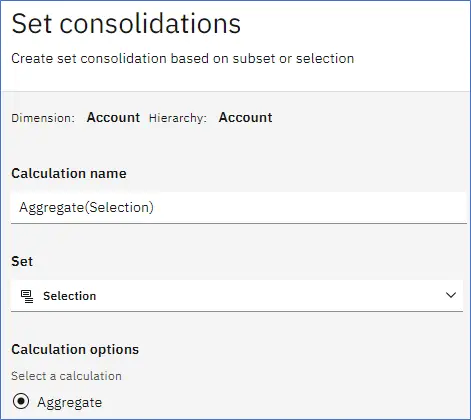
From the Options Menu on a Context dimension, select “Set consolidations.”
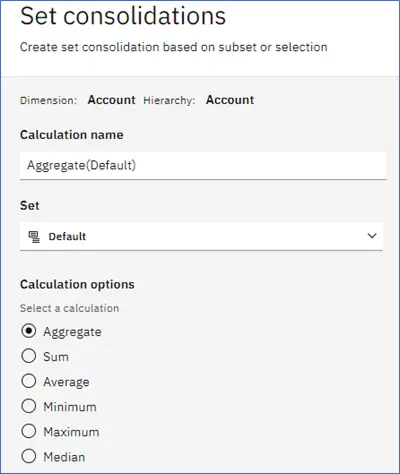
In the “Set consolidations” dialog box, you can select the set (named or unnamed) and the calculation type. By default, the “Calculation name” changes based on your selections. If you enter a custom name, the name stays constant and will not react to selection changes.
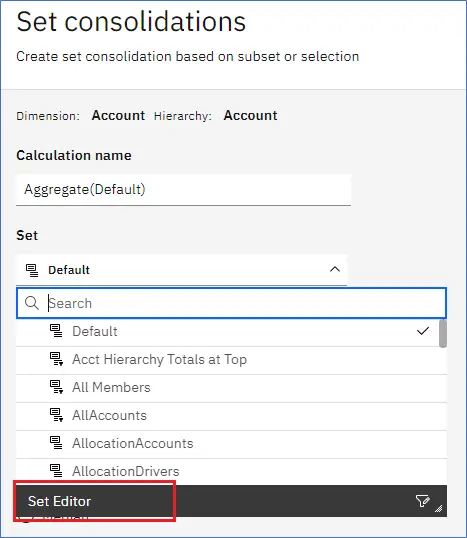
To add an unnamed set member, click the “Set” drop-down menu and click “Set Editor.”
Using the Set editor in the example below, we started with the Analysis set and then added six more accounts to create the unnamed set to be used in the calculation.
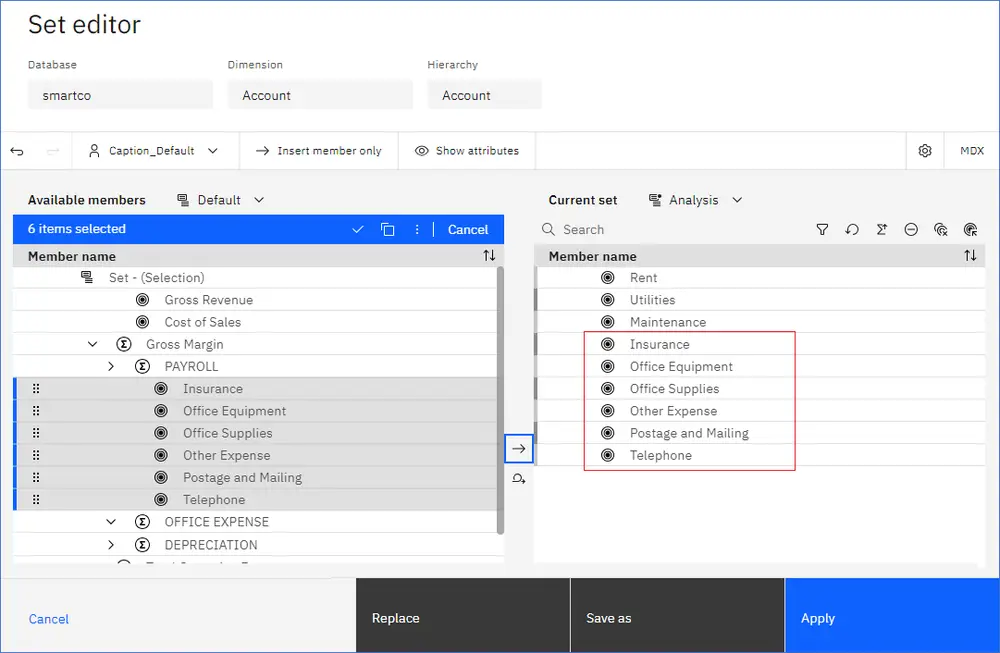
Click “Apply” or “Replace” to create the unnamed set for your calculation.
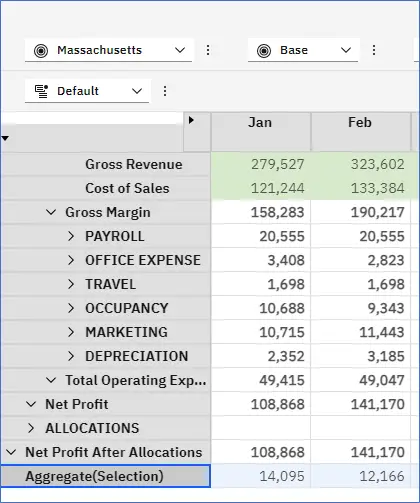
The members of the new consolidation have been selected and we will leave the calculation name as is.
After clicking “Apply” on the above, we can see our new consolidation in the view below.
For more information, see Add a set consolidation to a view.
Lock Row Header Widths
Release 2.0.96 – May 28, 2024
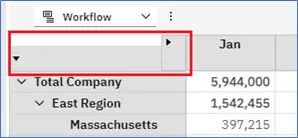
Locking the Row header prevents the Row header from changing widths when you expand or collapse a consolidation on the rows. The width is also locked for any hierarchies or Row headers that are added to the report.
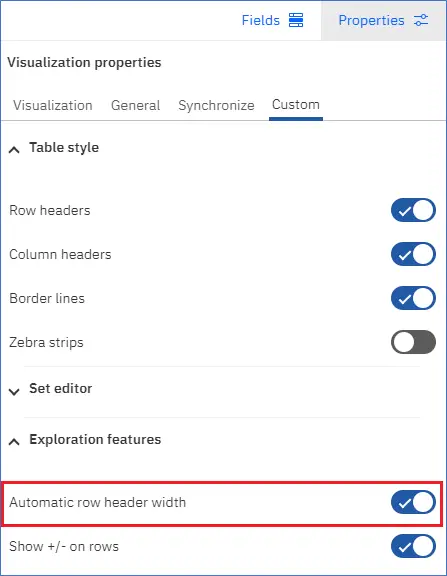
To lock the width of the row header columns:
1. Click “Properties.”
2. Select the “Custom” tab.
3. In the “Exploration features” section, ensure “Automatic row header width” is enabled. This option is turned on by default.
Additional Click Options on an Action Button
Release 2.0.96 – May 28, 2024
You can configure the behavior of an action button when it’s clicked a second time while already executing a TurboIntegrator process.
In previous versions of Workspace, clicking an action button a second time canceled the process if it was already running a process.
In the Properties panel on the Run Process tab, use the “Additional click options” setting to configure click behavior when an Action button has additional clicks.
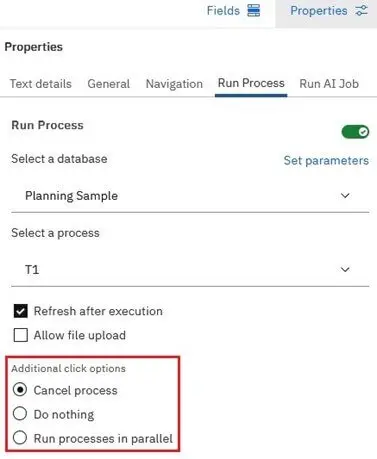
Additional Click Options:
- Cancel process – (default) cancel the process if the action button is clicked again while the process is running.
- Do nothing – no action is taken if the action button is clicked again while the process is running.
- Run processes in parallel – start a new process if the action button that is running a process is clicked again. The previously executed process will continue to run until completion.
Use this option if users are likely to run a series of overlapping processes using the same action button.
You can run a maximum of 5 processes in parallel. If you attempt to run the 6th process, a message about this limit is displayed.
Improved Error Messages and Error Handling
Release 2.0.96 – May 28, 2024
There are two new kinds of error messages that can be displayed in Universal Reports: MDX error messages and parser error messages.
Below, the MDX error message:
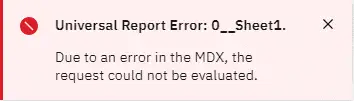
An MDX result is responsible for the names of the row and column members, the toggles for the rows and columns, and the data at their intersections. An MDX query comprises several elements, including slicer values, a valid server name, a data source, a cube, and any other components necessary for the query. When the generated MDX cannot be evaluated, an MDX error toast message is shown. If an MDX error is shown, you can click the “Show format areas” button on the PA for Excel toolbar and check the data source, the server, the slicers, and the TM1Set formula values for missing or incorrect data. Most of the values in the format area are auto-generated when a Universal Report is created from PA for Excel. Check the tm1web.log.file for more details on the MDX error.
The image below shows the parser error message:
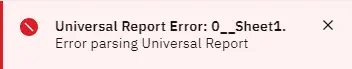
A parser error message includes information for the row and column axis, slicers, and hierarchy selections. The parser error toast message is generated when one of these key elements (row and column axis, slicers, and hierarchy selections) cannot be evaluated by the Universal Report.
If a parser error is shown, you can click the “Show format areas” button on the PA for Excel toolbar and check the query, row axis sets, and column axis sets for missing or incorrect data.

Check the tm1web.log.file for more details on the parser error.
Show and Hide Format Area
Release 2.0.96 – May 28, 2024
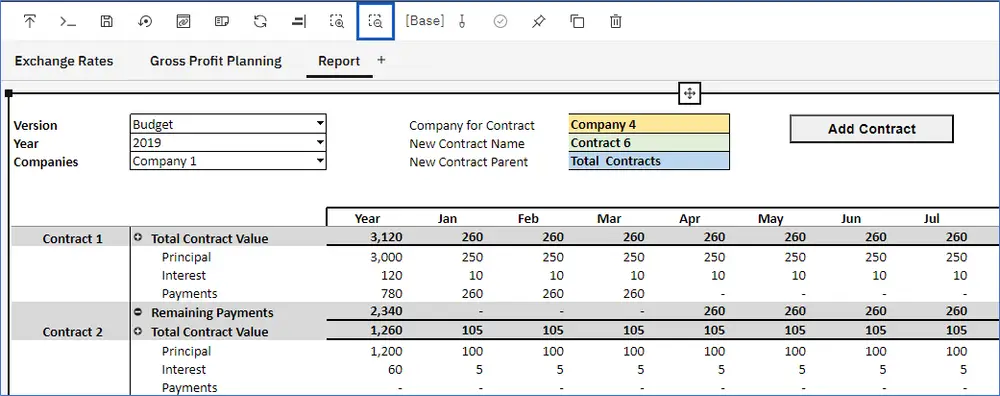
Two new buttons have been added to the toolbar that allow you to show and hide the Universal Reports and the Dynamic Reports format area. You can customize the named ranges when the format area is shown. Click anywhere within the websheet to highlight it and the toolbar will appear.
Click the “Show sheet format area” icon , to display the format area as shown below. Highlighted Format areas.
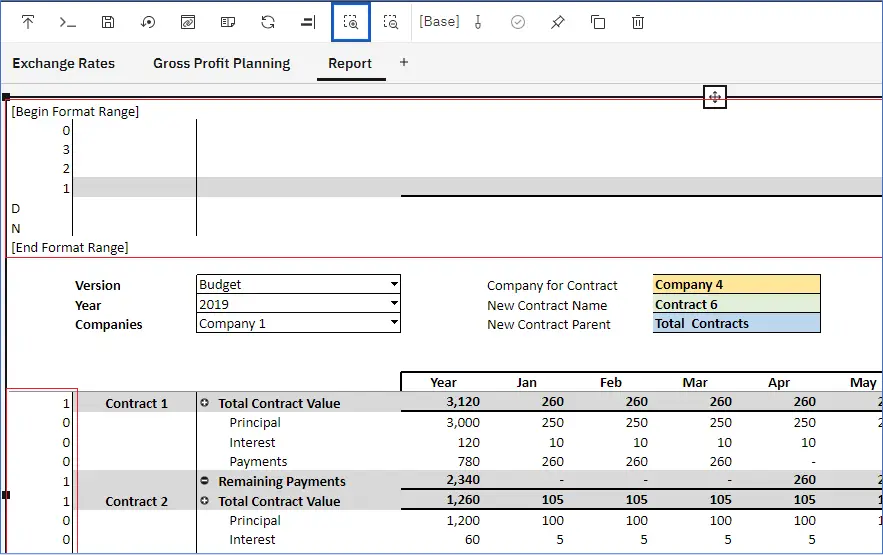
Click the “Hide sheet format area” icon to hide the format area on the web sheet.
Action Button References Updated for Copy and Paste Actions
Release 2.0.97 – July 16, 2024
When you copy and paste multiple books from one folder to another, action buttons within the books that reference any of the simultaneously copied books are automatically updated. The action buttons are updated to point to the new location of the copied books, rather than their original location.
If you copy and paste a book to a new folder, but it contains an action button referencing another book not copied from the original folder, the action button will continue to reference the book in the original folder.
Plot Members from the Same Dimension in Certain Charts
Release 2.0.97 – July 16, 2024
Selected visualizations can now plot members from the same dimension, making it easy to view and compare them quickly.
In the example below, three members of the month dimension display in the “Column” chart as the column “Length.”
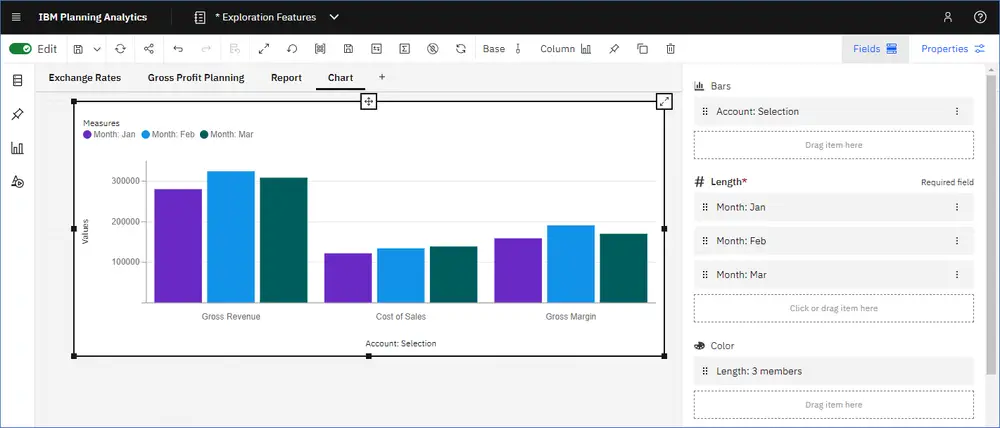
In the Fields panel, the Color field shows the Length with three members that display in different colors.
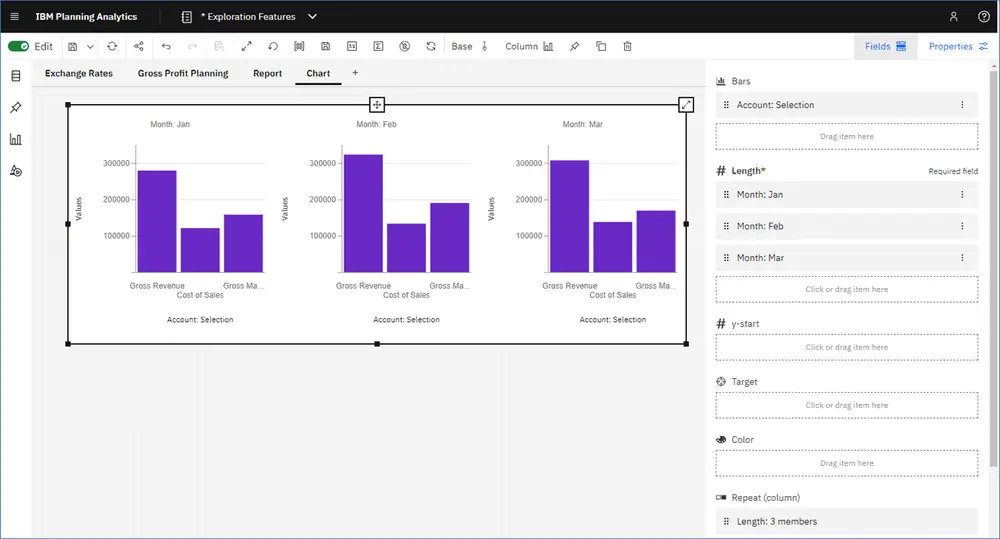
The three-member item in the “Color” field acts like any other hierarchy. You can drag it from the “Color” field to other fields like the “Repeat” (column) to see individual charts for each member.
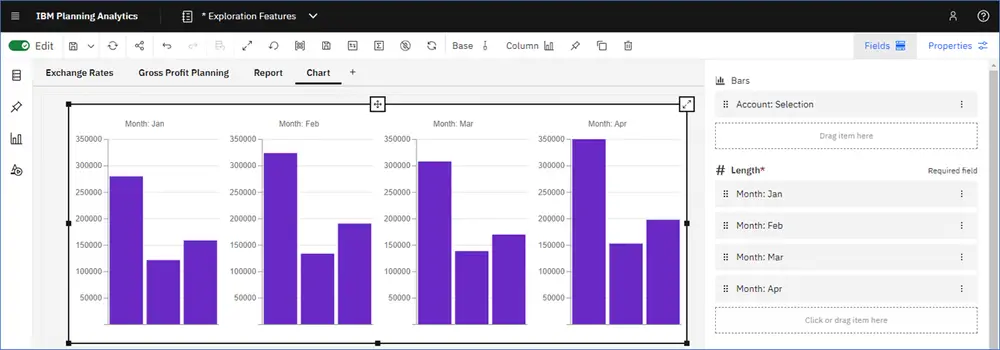
You can click into an empty “Length” field to plot another member. When the set changes, the “Length” field also updates to show the members in the new set.
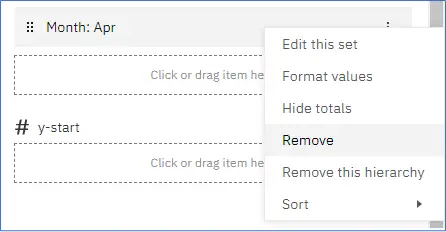
To remove an existing member, click the menu icon for the member you want to remove and select “Remove.”
The visualizations below can plot multiple members from the same dimension:
ColumnLineLine and columnBarStacked barStacked columnMarimekkoPointArea
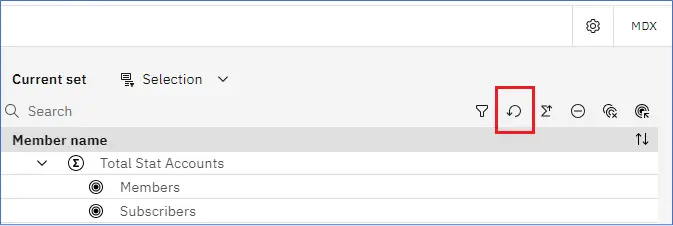
Refresh MDX Query UpdatedRelease 2.0.97 – July 16, 2024Refresh the “Current set: and the MDX query without making any changes to the set or the MDX string.Use the “Reset” button on the Current set in the “Set” editor to refresh the set even if there are no changes to the set.
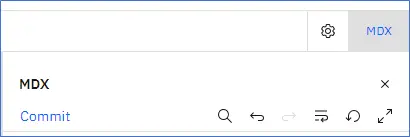
Also, use the “Commit” button in the MDX window to refresh the query without any changes to the MDX.
Before this release, the “Reset” and “Commit” buttons were disabled until changes were made.
Format Spacer Cells
Release 2.0.97 – July 16, 2024
Using the Format manager, apply formatting to the spacer cells in a view.
Add Spacers to rows or columns. Right-click on a row or header member, go to “Add spacers” and then select where to place the spacer.
Data Spreading can be impacted by the spaces. Below, in the highlighted row, a percent change rate was applied in January and to all months to the right. However, the applied changes ended with March and did not affect April through December.
Spreading applied at Total Year appears to work fine.
Pro Tip: add spaces to explorations that will serve as reports or analysis tools. Avoid adding spaces to explorations where you expect user data entry.
In Format manager, within the View section, click Spacers.
Format Spacers within your view. Select a fill color and/or control line divider visibility.
Next Steps
As you explore the latest enhancements in Planning Analytics Workspace (PAW) , it’s crucial to leverage these features effectively to drive better outcomes for your business. Whether you’re optimizing existing reports or building new ones, choosing the right partner can make all the difference. With PMsquare’s expertise in PAW and data analytics, we can guide you through these updates, ensuring a smooth and impactful implementation. If you have any questions or need support in optimizing your PAW environment, don’t hesitate to reach out to PMsquare today.
I hope this article has sparked some fresh ideas on how to harness the power of PAW’s new books and reporting features. To stay ahead with the latest updates and best practices, be sure to subscribe to our newsletter for expert insights delivered directly to your inbox.
Published Date: