

Share


Mark Karas, April 8, 2024
Get the Best Solution for
Your Business Today!
This article will cover one of the often-overlooked features of Cognos Analytics that has been in the application since its early days, when it was known as Cognos ReportNet, Page Sets. Page Sets are a particularly useful tool when the requirement is to show data by some sort of grouping… by Product Line, for example.
Assumptions:
- User has Access/Capabilities to the report editor in Cognos Analytics.
- User has Access to/knowledge of a data source for authoring.
- User has basic knowledge of authoring in Cognos Analytics reporting.
Table of Contents
What is a Page Set?
Page Sets are query driven and primarily used to generate a page for each occurrence of some sort of grouping of descriptive information. In word processing terms, “Page Breaks” might be the best way to describe a Page set in Cognos Analytics. Similar to the Repeater object, the Page Set will “repeat” or, in other words, create a new page for each occurrence in the query. This can be helpful in tidying up reports destined for PDF output. I find Page Sets are especially useful when used in conjunction with Excel formatted output, where a new tab will be generated in the Excel output for each occurrence, which can really take a report to the next level.
Note: In interactive (HTML) output, Page Sets can only be used when the report is NOT rendering pages as tabs, unfortunately.
OK, let’s build a simple report and incorporate a Page Set.
Building a Report Using Page Sets
We’ll use our favorite sample package, GO Sales (query) for our example, and specifically within the “Sales (query)” namespace. We will author a crosstab that displays Revenue by Retailer Type by Year. We will then create a Page Set to show this breakdown of data, for each Product Line:
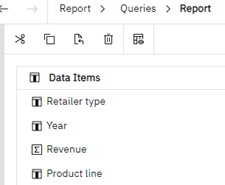
- Create a query, called “Product Lines” which will eventually be the Page Set’s query. It just needs 1 data item, the “Product Line.”
- Navigate to the Pages view, where there should already be a Page, if not create a page.
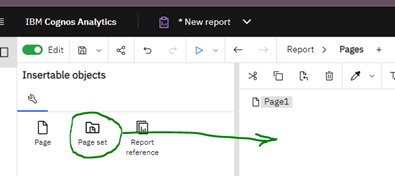
- Drag a Page Set into the pages area below to the page that is already defined
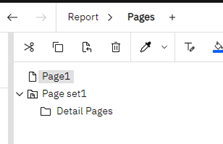
- Click “Page1” and drag into the Detail Pages folder under the new Page set
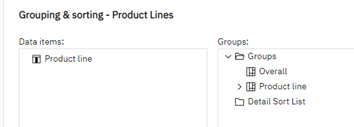
- Click on Page set1, so some properties can be set. Set the following properties:
- Name: “Product line page set”
- Query: “Product lines”
- Grouping & Sorting: “Product line” -> add under Groups
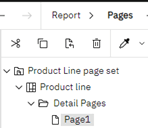
- Navigate to the page named “Page1”
- Drag
- a Crosstab onto the page. Change the name of the query to “Report.” Define the crosstab as follows:
- Rows: Retailer Type
- Columns: Year
- Measure: Revenue
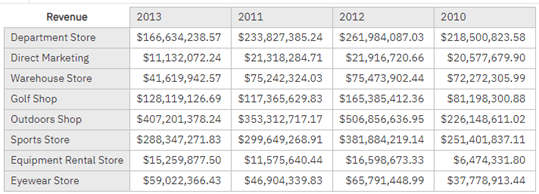
- As shown above, this is the data for all Product lines and is not what is required. The data in the crosstab now needs to be associated with the current product line via the page set. We will do this via the crosstab’s Master Detail relationship property. Before we can do this, however, we need to include the Product line in the Report query. To do this, navigate to the “Report” query
- From the “Products” dimension, drag the “Product line” into the query
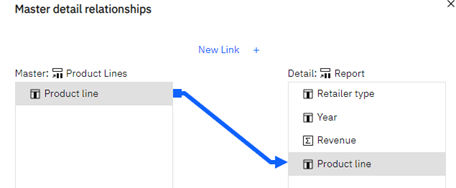
- Navigate back to “Page1” and select the crosstab already defined, then go to the Properties pane on the right and find the Master detail relationships property and click the 3 dots icon at the right.
- On the Master detail dialog that is now displayed, click New Link, and ensure both ends of the link are set to use “Product line” and click OK.
- Above the crosstab, drag in a Layout Calculation and set its Report expression to [Product line]. This will use the Product line from the Page set we created to show the user which Product line the data is for. Feel free to style this label as you see fit.
- Run the report and now the data on each page is filtered by each page’s Product line.
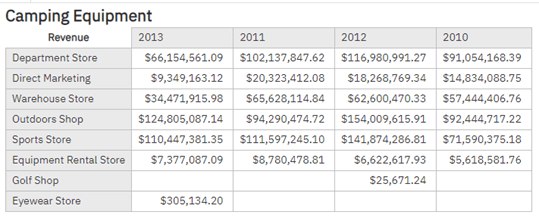
- Run the report and set output to Excel. You will see a tab for each Product line:
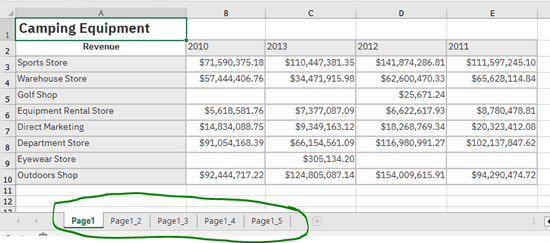
Note: There is an advanced system property that can be set so that Excel tab names show the label value, rather than the page’s Name property, as is being shown above. Visit IBM’s page on this subject here to see how to turn this feature on.
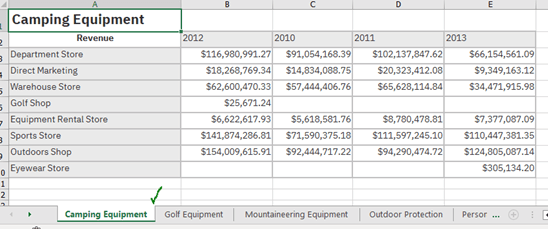
Here is the Excel output after making this system setting change… note the nicer tab names:
Other Notes on Page Sets
- Page sets can be nested within page sets giving quite a bit of flexibility if necessary.
- Page sets may not work as well with dimensional data sources, such as TM1 cubes… Page Layers may be a better solution in these cases.
- Page Set Example
Conclusion
Hopefully, this article helped give you a better understanding of what Page Sets are and how they can be used to author more advanced reports in Cognos Analytics. If you have any questions, or would like PMsquare to provide guidance and support for your analytics solution, contact us today! Be sure to subscribe to our newsletter to have PMsquare articles, updates, and insights delivered straight to your inbox.
Published Date: