
Viola Brudniak, February 12, 2024
Get the Best Solution for
Your Business Today!
You’re diving into your data, and suddenly, you want to see how things looked around a certain time, but without the headache of pinpointing certain dates. This is where relative time comes in! You get to filter data with ease and see current trends. Join us as we investigate how relative time works and what to do in situations where time falls out of a certain business requirement.
Incorta has a robust set of features supporting relative time analysis, including a built-in relative time function for both Gregorian and fiscal calendars.
We recently received a customer request asking to see the data for the same day as today but from the previous year. This seemingly straightforward request fell outside of the built-in time functionality. We understood that our existing tools didn’t cover this specific need, so we had to do some digging within the schemas to see how the dates were being formatted.
In most cases, “last year” is a simple calculation – same date, one year ago. In this case, we needed to work with the business to determine the best definition for their purpose.
After some exploration, we clarified that ‘last year’ means the fiscal day number equal to the same fiscal week number in the prior fiscal year. It’s important to mention these two elements, while linked, aren’t identical. This difference between the two determines the time frame we’re working in.
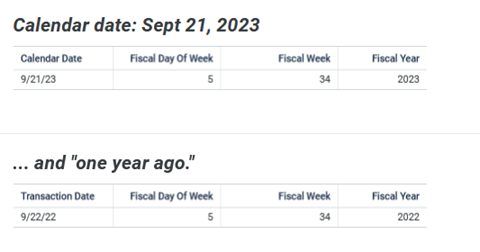
*Note: The “same day” last year for Sept 21, 2023 is Sept 22, 2022.
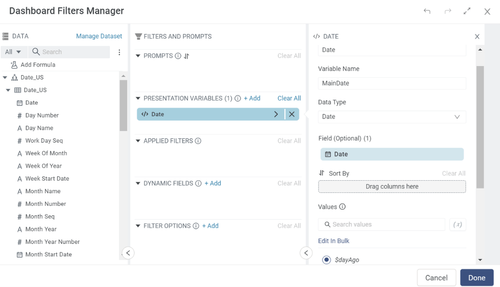
*Note: Data Filter utilizes $dayAgo session variable across the dashboard.
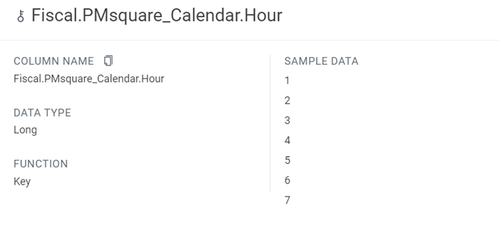
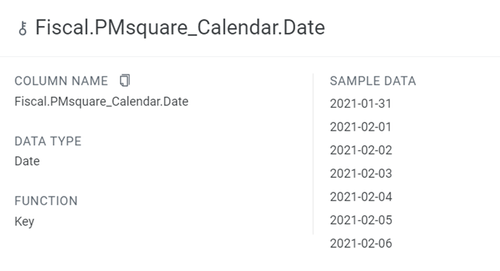
Since the fiscal calendar can be defined (or redefined) however the business deems best for them, we can’t simply subtract one day and one year in our formula. The next section aims to provide a clear understanding of why adapting formulas to a business’s fiscal calendar is essential for accurate and meaningful insights.
This Year Formula
The formula we are using utilizes Incorta’s lookup() function. This is a great function with a lot of utility, but don’t forget that the queried table columns need to be defined as keys and every key needs a value.
In our lookup we are querying the “Date_US” table, detailed down(grain) to each hour. We need to pass along both an hour and a date, so we are able to find the information we are looking for.
Our analysis has a grain of “date” which needs to be flexible and promptable hence presentation variable PV_BusinessDate. We aren’t analyzing by the hour, so we pass the numeral “1” to prevent the cardinality from producing the result based on that relationship.
Before getting into the syntax, it is important to understand each and every component and how it results in your desired time frame. In this case where you are creating a formula to find results from this year, utilize the sum statement to get the sum of the whole result, then implement the case statement to return a result based on multiple conditions, and finally include an AND statement to link the conditions together as one result.
The conditions, detailed below, are also important to understand as each one has a role in how the results would be influenced. These conditions are similar with the exception of the first two columns which affect what date you are planning to implement.
/* Step one: Find the fiscal day of week number */ sum( CASE( AND((Date_US.Date_US.Fiscal_Day_of_Week = lookup(Date_US.Date_US.Fiscal_Day_of_Week, Date_US.Date_US.Date, $PV_BusinessDate, Date_US.Date_US.Hour, 1 ) ), /* Step two: Find the fiscal week number */ (Date_US.Date_US.Fiscal_Week = lookup(Date_US.Date_US.Fiscal_Week, Date_US.Date_US.Date, $PV_BusinessDate, Date_US.Date_US.Hour, 1 )), /* Step three: Find the fiscal year */ (Date_US.Date_US.Fiscal_Year = (lookup( Date_US.Date_US.Fiscal_Year, Date_US.Date_US.Date, $PV_BusinessDate, Date_US.Date_US.Hour, 1 /* Notice the “-1” which pushes us back one year from the prompted value’s fiscal year */ ) - 1)) ), Sales.NetSales, 0 ) )
Once we have the logic above, it’s easy to compare sales from “today” vs “last year” with a small quick tweak:
Date_US.Date_US.Fiscal_Day_of_Week =
lookup(Date_US.Date_US.Fiscal_Day_of_Week,
Date_US.Date_US.Date,
$PV_BusinessDate,
Date_US.Date_US.Hour,
1
)
vs.
Date_US.Date_US.Fiscal_Day_of_Week <=
lookup(Date_US.Date_US.Fiscal_Day_of_Week,
Date_US.Date_US.Date,
$PV_BusinessDate,
Date_US.Date_US.Hour,
1
)
This example illustrates how to expand our analysis from comparing single days to comparing weeks to date numbers.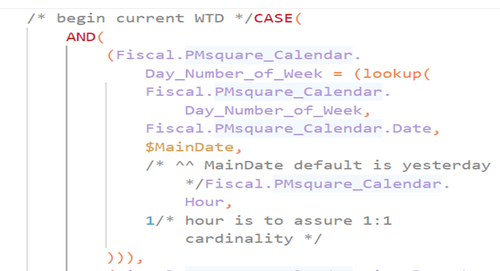
- Start of CASE statement
- Start of AND statement
- Day Number of Week results equal to these conditions
- Date column(return date from the calendar schema)
- Custom-made Session Variable ($MainDate)
- Hour(1 = 1:1 relationship)
The second component focuses on the fiscal week.

- Fiscal Week results equal to these conditions
- Date column(return date from Calendar schema)
- Custom-made Session Variable ($MainDate)
- Hour(1 = 1:1 relationship)
The third and final component focuses on the fiscal year condition.
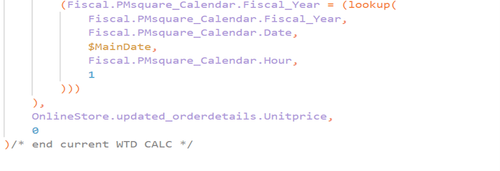
- Fiscal Year results equal to these conditions
- Date column(return date from Calendar schema)
- Custom-made Session Variable ($MainDate)
- Hour(1 = 1:1 relationship)
- Implement unit price as the result
- End of AND statement
- End of CASE statement
Utilizing this code will show the result of this year’s sales.
Week to Date formula
For the first component of the code, start with a CASE statement to return multiple instances. Then place an AND statement to make sure all of the conditions are met.
The first component focuses on day number of week in order to get the sales during that day. Implement a lookup function in order to get a result from a table that isn’t joined.
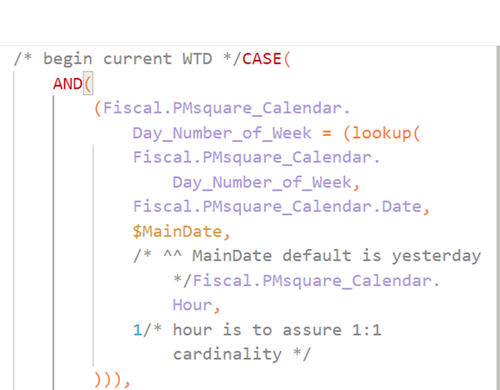
- Day Number of Week equal to these conditions
- Date column(return date from Calendar schema)
- Custom-made Session Variable($MainDate)
- Hour(1 = 1:1 relationship)
The second component focuses on the fiscal week.

- Fiscal week results equal to these conditions
- Date column(return date from Calendar schema)
- Custom-made Session Variable ($MainDate)
- Hour(1 = 1:1 relationship)
The third, and final, component focuses on the fiscal year.
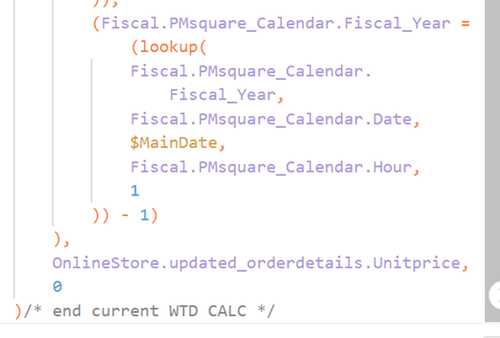
- Fiscal Year results equal to these conditions
- Date column(return date from Calendar schema)
- Custom-made Session Variable ($MainDate)
- Hour(1 = 1:1 relationship)
- The “- 1” is to get the last year date
- Implement unit price as the result
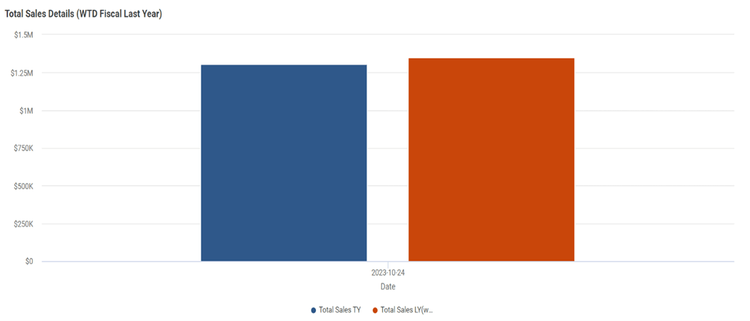
This is the result of the code we procured. The column chart illustrates the difference between the total sales from this fiscal year and last fiscal year using the week-to-date calculations that we created. As you can see, this year’s numbers are slightly below the same week last year, meaning there were less sales overall.
Conclusion
Creating the perfect data calculations for a specific time frame may seem like a bit of a hassle, but once you grasp the basics, it’s easy to find exactly what you’re looking for. Let’s say you’re curious about the sales data from the same week last year—it’s not only choosing a date on a calendar. You navigate through Incorta’s schemas and tables to troubleshoot and pinpoint the sales information you need.
We hope this article was helpful in your understanding more about how Incorta utilizes relative times. If you have any questions, contact us today! And, if you would like to hear more about utilizing Incorta, please let us know.
Published Date:


