

Share


Ronald Shoniwa, December 20, 2022
Get the Best Solution for
Your Business Today!
Cognos Analytics includes a powerful reporting tool that offers versatile data presentation. Data is most commonly represented in a List: a table very similar to spreadsheets and the “table” object in other common reporting tools like Tableau and Power BI. Alternatively, a Crosstab object can be used which provides another perspective on the same data. Also known as matrix reports, they help to highlight relationships between three or more query items showing data in rows and columns with information summarized at the intersection points. Think “Pivot Table” in Excel.
Within most Cognos report objects there are numerous property settings that allow customization to match precise report requirements. It’s even possible to fine-tune aggregations to work in a specified order. For example, the Solve Order setting in a crosstab can be used to define the order in which calculations are performed. With all these properties however, Cognos does not have native functionality to add tooltips (with the notable exception of inside visualizations).
Table of Contents
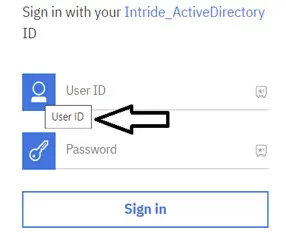
What are tooltips
Tooltips provide the user with additional information about a page element or feature and are common on modern web pages and web apps. For example, password boxes pop up messages that appear on mouse hover or click, advising on format and number of characters.
Fortunately, there is an easy way to add those very important intuitive little objects we all love to our daily/weekly/quarterly/yearly chunks of prepared ingestible data. All it takes is an “HTML item” found under the ADVANCED in the Cognos toolbox and a bit of basic HTML code.
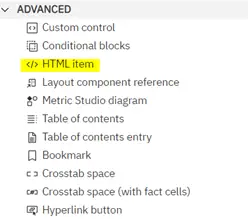
HTML Item
An HTML item object in Cognos is essentially a container into which you can add HTML, such as a link to a multimedia file.
Important Note: HTML items will only appear when you run the report in HTML format. Sorry, we can’t add tooltips to a PDF or Excel file!
How?
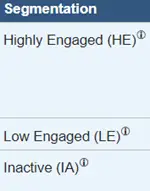
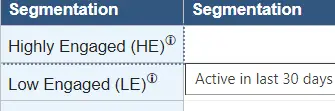
In this example, we have a report that measures engagement of users. It has a “Segment” column which houses a list of categories written in an abbreviated form that cover certain calculations that might not be immediately recognizable/obvious within the category names themselves.
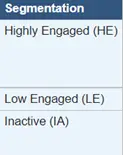
The question would be, what is “Highly Engaged (HE)”? What are the criteria used to place a user in that bucket? And finally, how do we add a tooltip to avoid being bombarded by users with e-mails asking us for a definition?
1. Add a Query item in the objects (List/crosstab) Source Query that has the description for each of the segments in question.
- Identify object source query
- On the object select the dots in the top left corner to select the whole object:
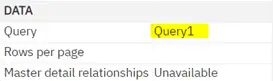
- In the properties section under “Query” (in the “Data” section), the name of the source query for that object will be shown:
- Go to the Queries section of the report and identify Query 1 open it and add a “QUERY CALCULATION” and name it “Segment Desc” for the descriptions and add a simple Case statement.
case Segment when 'Highly Engaged (HE)' then 'Active in last 30 days ‘ when 'Low Engaged (LE)' then 'Last activity in 31-90 days’ when 'Inactive (IA)' then 'Last activity was over 180 days prior’ else ''End(Of course, this is assuming that the definition isn’t already in the database. If it was, just use that field!)
2. Add HTML items on the report page
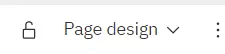
NOTE: To be able to add the item within the cell you should unlock the small lock icon next to the Page Design/Preview toggle top right of the page. Otherwise, Cognos will not allow you to access the items in the selected cells on the crosstab or list object
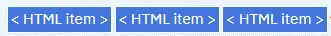
- Ensure you are in “Page Design” model and add three HTML items in the category cell. These three items will house different parts of the HTML code required for the tooltip.
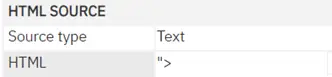
- While the first tag is selected, navigate to the properties section (right of the screen) and add the above script as shown below:
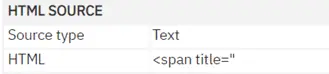
NOTE: Modern web browsers interpret the “title” attribute as a tooltip, which is key to understanding how this technique works.
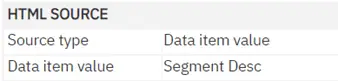
- Select the second tag and change the source type to Data Item Value then select the Data Item you added in step 1 in the space shown in black as shown below:
- Select the third tag and add the closing text as shown below:
- After this, add the Data item (not the description we added earlier)
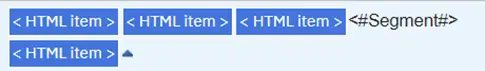
- Finally, add the last HTML item after the Data Item and on this you want to create an icon that allows the text to pop up on hover
Last HTML item = <sup>🛈</sup></span>
- Run your report and the report categories should now appear with icons at the end
If you hover over the “Info” icon, it will show the text that was input on the Case statement as shown below:
Conclusion
Tooltips are useful in terms of communicating information and guiding users to the answers they seek when using reports (while avoiding visual clutter). While Cognos may not have a tooltip property or button, it provides all the control needed for a report developer to easily add a tooltip to a report. Though not covered in this article, it’s worth noting that with a bit more code (including some CSS), tooltip functionality can be expanded to allow for full control over how a tooltip looks, including formatting of the text inside.
We hope you found this article helpful! If you need help with reporting or just want to talk shop, reach out to us!
Be sure to subscribe to our newsletter to have PMsquare original articles, updates, and insights delivered directly to your inbox.