
Share


Paul Mendelson, December 20, 2022
Get the Best Solution for
Your Business Today!
Of the various data containers in Cognos, Crosstabs offers the most flexibility. With the flexibility comes a great deal of complication. From a simple two-dimensional layout to complicated multilevel nesting with subtotals and fancy formatting – the limit is really down to your imagination.
Table of Contents
Layout
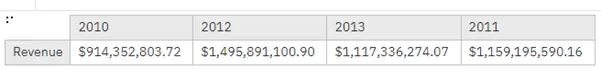
Let’s start with the basic layout. Columns, Rows, Measures (Intersections). It’s a little misleading – a measure can be placed in any of the locations.
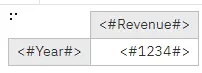
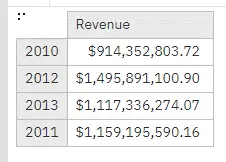
That is a basic layout with an attribute on the rows, and a measure in the columns.
We can switch it to show the measure in the rows:
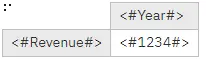
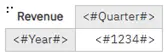
The measure can even be put into the intersections with attributes on both the rows and columns:
I would describe these as fairly simple layouts. We can start having a lot more fun with this.
Nesting Items
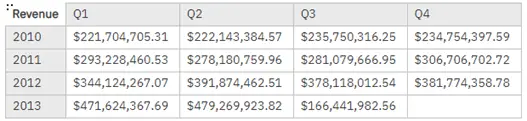
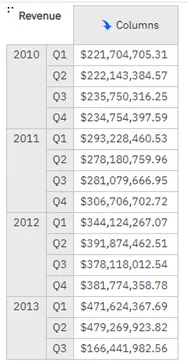
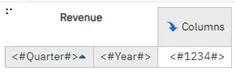
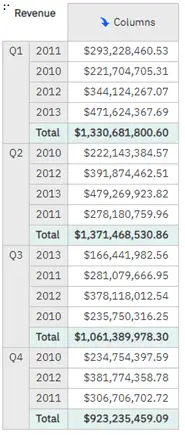
The attributes can be nested in many different ways. Let’s start with nesting Quarter in Year:
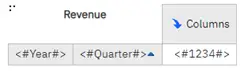
We could do the reverse of course, nesting Year inside Quarter:
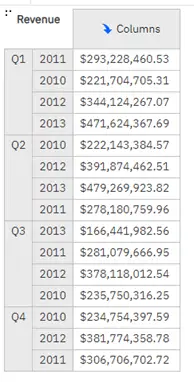
The numbers are the same, but they tell a different story. What is more important to know? The data by quarter or by year? With the second layout we can very easily see that Q1 was showing consistent growth year over year, but something seemed to have happened in Q2 2011.
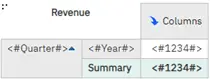
Let’s get a bit more complicated, we can add subtotals in a few different ways.
Formatting
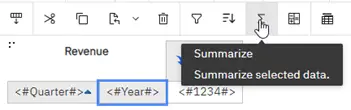
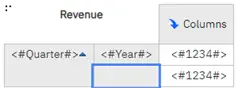
The Summarize button will automatically add a summary row for the selected node:
You could drag in a crosstab spacer with fact cell:
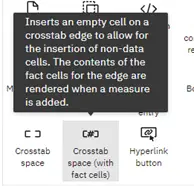
Or you could even nest the same data item twice:
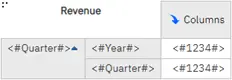
They do different things, but in this case all three will look almost identical:
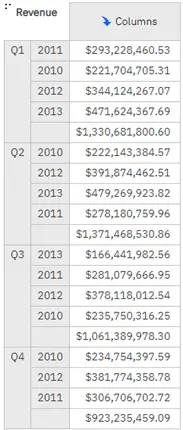
Let’s go over each one.
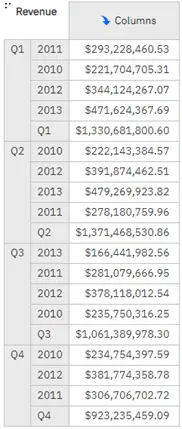
In the first case we’re using a shortcut to make this calculation: total(currentMeasure within detail/set [Year]). The detail or set option is if you’re using a relational or dimensional source. This calculation will total the data items, which might return a different total if the rows are filtered in some way. Let’s say you’re pulling the top 10 products, this would return the subtotal for only those products. In here we’re not filtering the years, so it returns the correct output. Since it’s totaling the rows, it may actually be slower than the next two options if you’re showing the overall total.
The second is just passing an empty space below the years. To the Cognos querying engine those rows look like it’s just a Quarter row.
The third is similar, but it’s specifically calling the quarter. Again, to the Cognos querying engine it will look like it’s just a Quarter row.
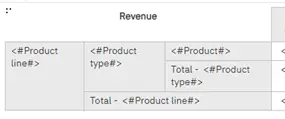
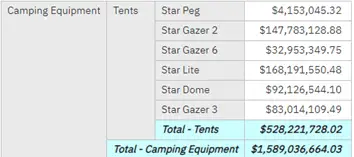
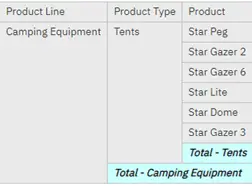
Let’s look at changing the contents of crosstab cells now. Consider this output:
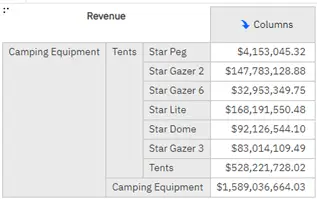
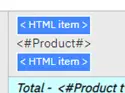
I want the subtotal rows to say “Total – {name}” and be formatted as total rows, and I want the individual product rows to have a tooltip showing the product description. The first bit is easy, individual nodes are really just table cells that have a text item inside it. Start by unlocking the report by clicking on the lock icon: Then drag in a text item:
Selecting Member Fact Cells
Next, let’s control-click on the total rows and then “Select Member Fact Cells”:
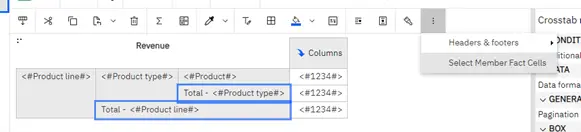
This will highlight all of the fact cells nested in the selected nodes. In this case it’s only one column, but if we have a dozen columns, this makes our lives significantly easier. Control click on the nodes again and we should see this:
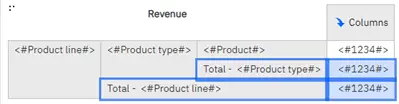
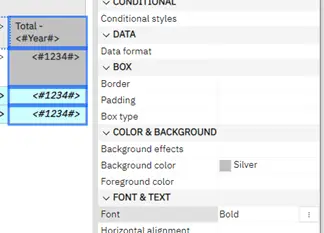
Let’s set the background color and font with these settings:
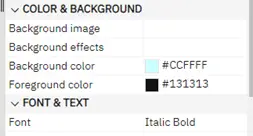
When we run the report we’ll see this:
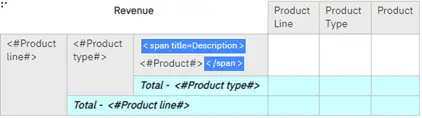
The tooltip is a little more difficult, but not insurmountable. Let’s start by dragging the Product Description into the query. Now with the report still unlocked, let’s drag HTML items into the product cell, before and after the product text item:
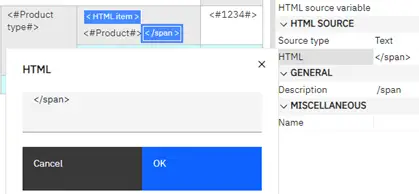
We’ll go backwards. In the second one set the Description to /span and the HTML to </span>
The first one is a little more complicated. First let’s change the Source type from Text to Report Expression:
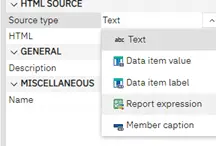
And let’s define the HTML Item like this:
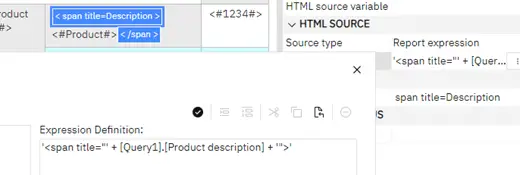
Since it’s a report Expression, we can drag in items from the query. Now, let’s run it now and see what happens.
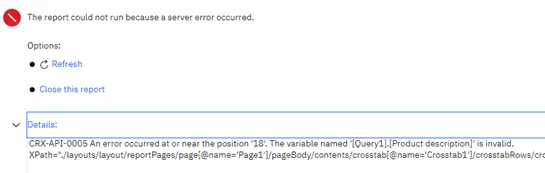
OH NO! We got an error!
Don’t worry, I knew this would happen. The Product description item doesn’t actually exist anywhere in the report, so Cognos doesn’t know what to do. To fix we can add Product description as a property to the node:
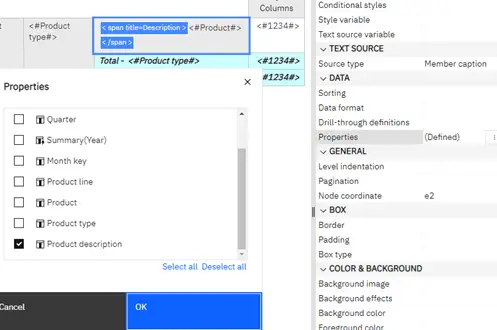
Those familiar with OLAP modelling should intuitively understand what’s going on here. We’re essentially saying that this crosstab node, and all of the items nested inside it, can access “Product description” as a property of Product. Let’s take a look at how it looks when we run the report:
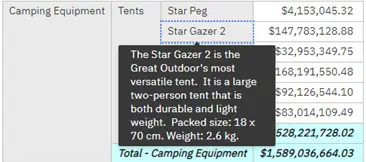
Cognos automatically styles the tooltip to make it look nice!
Now here’s a nitpick. Even though WE know what the columns are, the users might get confused. How can we get column titles for the row nodes?
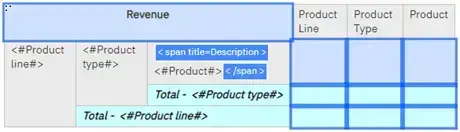
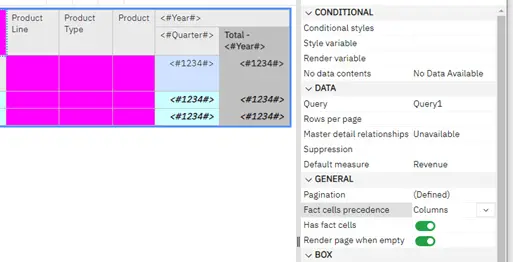
Let’s start with dragging in three crosstab spacers into the columns (remember to lock the report again), naming each of them appropriately.
Now let’s control click on the three nodes in the column, Select Member Fact Cells, then control click on the crosstab corner:
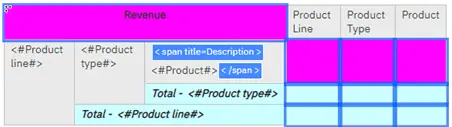
Set the Box type to None and Background color to Fuchsia:
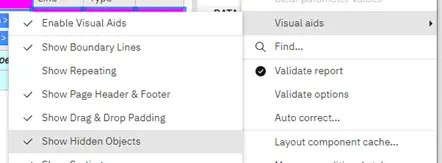
PROTIP! If the cells disappeared, set “Show Hidden Objects” in the visual aids menu:
Now when we run it we see column titles for the rows:
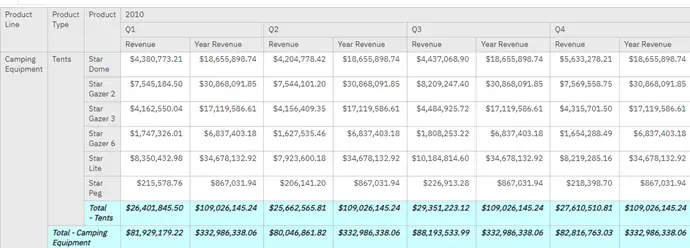
Let’s add Years and Months to the columns, and set the formatting the same we did with the rows:
But look, the Year totals still have blue, I want to see silver! The rows formatting overriding the column is actually a setting that is on the crosstab:
Now we have a nice looking crosstab:
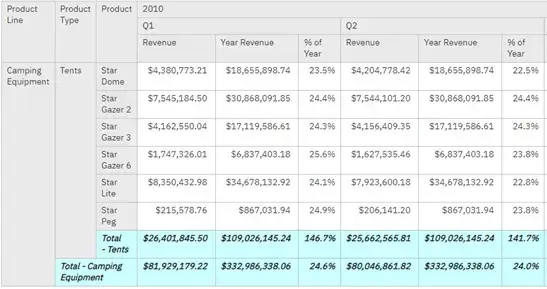
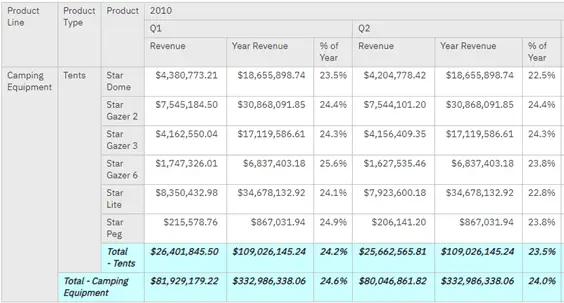
There is one more thing to do. In addition to seeing the total revenue, I also want to see the percent of revenue by quarter against the year:
I have here a crosstab here with both Revenue and Year Revenue. The calculation is simple, [Revenue] / [Year Revenue], but let’s see what happens if I use that:
Sort Order
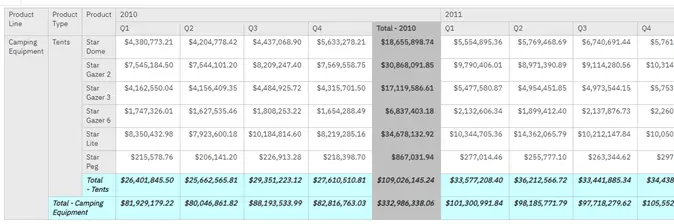
It looks good, but what’s this? The Total – Tents is showing 146.7%? What’s going on? Well, the total on the Product row is using total(currentMeasure within detail [Product]), whereas the Product line total is just the member. We could fix is by replacing the total for product with the member, but let’s pretend we can’t.
We’ll say we’re totaling the top 10. Sure.
So why is it showing 146.7? 26,401,845.50 / 109,026,145.24 is 24.2%. But look, adding the rows 23.5, 24.4, 24.3, 25.6, 24.1, 24.9 adds up to 146.7! How can we fix this? It’s down to Solve Order. By Default Cognos will first calculate the items on the columns, then the rows. So we need to specifically instruct Cognos which items to resolve first.
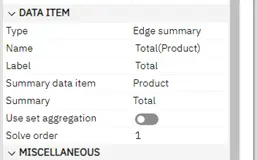
For the total Products row, let’s set the solve order to 1:
And the % of Year we just set to any number above 1. We have a few to pick from, but we’ll stick with 10:
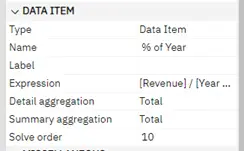
Why not 2? Well, if for some reason we need to add a calculation that needs to be processed before the % of year, we can set that to 5. Or 6. It’s just future proofing, which is a good habit to get into when building to client specifications that may or may not change at any given moment.
And look, it works!
So what have we learned? Nesting items, hiding cells, subtotals, formatting, selecting member fact cells, sort order, and the magic of friendship. There is plenty more to learn about Crosstabs, and I’m sure to write about them later.
Next Steps
We hope you found this article to be informative and helpful. If you have any questions about Crosstabs in Cognos, contact us today. Be sure to subscribe to our newsletter for more PMsquare articles, updates, and insights delivered directly to your inbox.