
Share


Rob Baierle, January 10, 2022
Get the Best Solution for
Your Business Today!
Table of Contents
Create Your Dimensions
This cube will have 3 dimensions, in the following order:
- }Processes
- Line Numbers
- TI Measures
Line Numbers Dimension
The line dimension should consist of a consolidation called “All Lines” with numbered lines (1 – 365+) rolling up to All Lines.
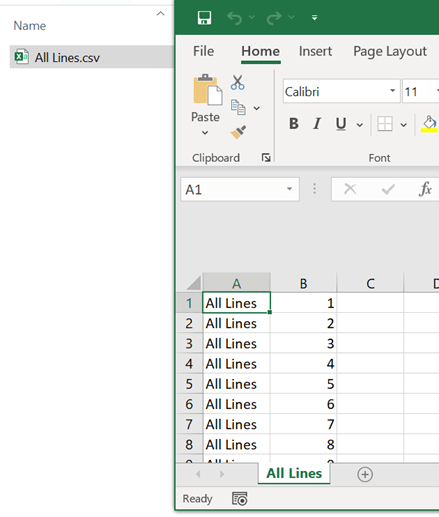
In Excel, Column A, enter the “All Lines” consolidation for every child line number as shown below. Save the spreadsheet as a .CSV vile and then import into Planning Analytics Workspace.
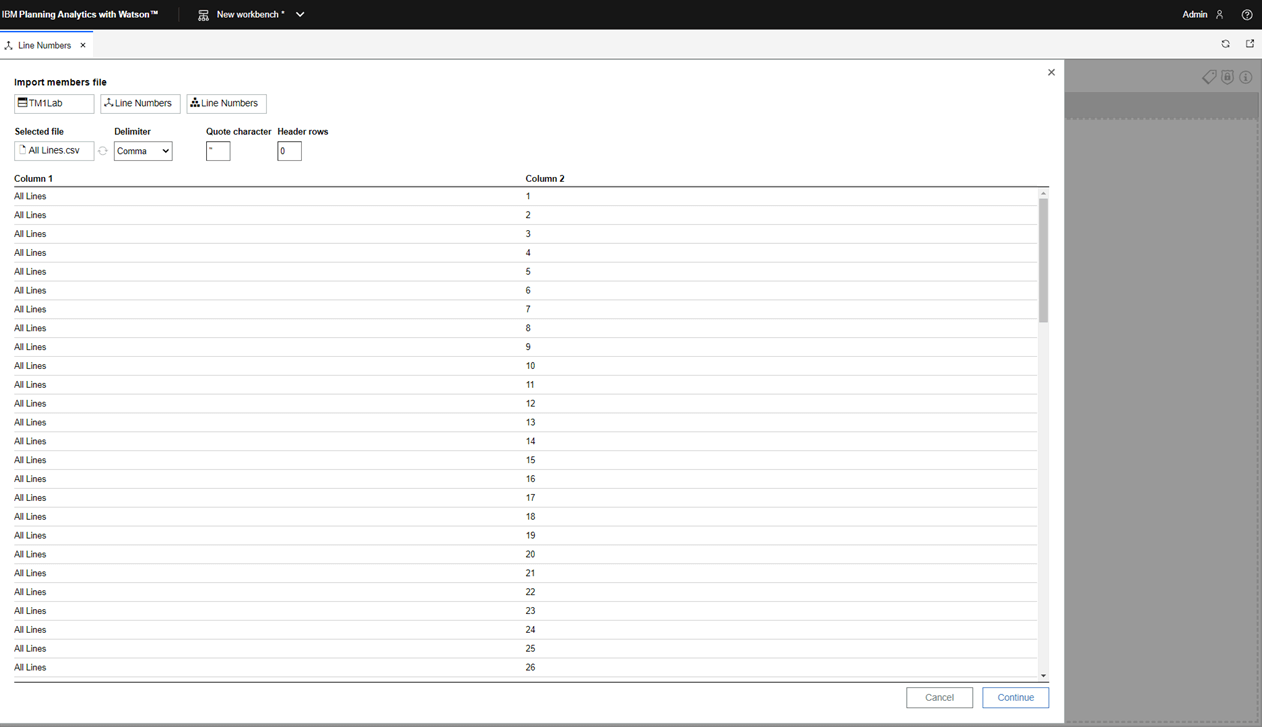
In PAW create a new dimension call “Line Numbers”.


If you did not include any column headers in the file, update the header rows to zero and click the refresh button. Click Continue.

In Dimension import settings, Mapping Type, make sure Parent-Child is selected.
Assign the columns to Parent and Child and click Import data.
You can see the dimension has been populated from the CSV file.

}Process
We will utilize the existing control dimension called }Processes that will contain all TI process names. New processes get added automatically to this dimension each time one is created.
TI Measures
create this dimension manually with the following, formatting occurs after the elements have been created and committed:
- Start Date as String, formatted as Date
- Start Time as a Number, formatted as Time
- End Date as String, formatted as Date
- End Time as a Number, formatted as Time
- Elapsed Time as a Number, formatted as Time
- Counter as a Number, no format
- Notes as a String, no format

Click on Commit.
Format the TI Measures dimension
Select the Start Date and End Date and format them as Date.

Select Start Time, End Time, and Elapsed Time and format as Time.

Create the cube
Create a cube named TI Tracker with the dimensions in the following order:
- }Processes
- Line Numbers
- TI Measures
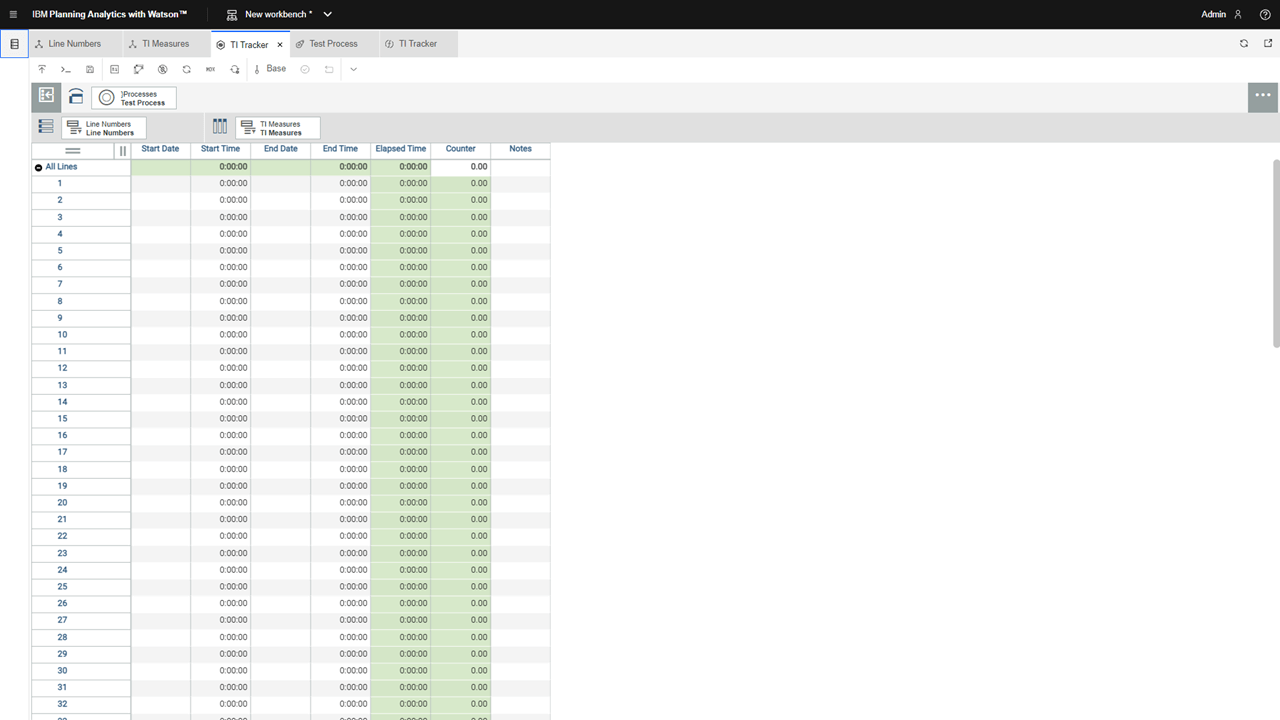
The cube should look like this.

Create Business Rules
Create new Business Rules for the TI Tracker cube and Save them:
[{'Start Date', 'End Date'}, 'All Lines'] = S: ''; [{'Start Time', 'End Time', 'Elapsed Time'}] = C: 0; ['Elapsed Time'] = N: ['End Time'] - ['Start Time'] ; ['Counter'] = N: IF( ['Elapsed Time'] = 0, 0, 1) ; ['Elapsed Time', 'All Lines'] = C: ConsolidatedAvg (2, 'TI Performance', !}Processes, 'All Lines', 'Elapsed Time' ) ;The Cube should now look like this:
We will be utilizing the measure named “Counter” at the intersection of “All Lines” to know how many rows already contain data. This will allow us to write to the next line by pulling this value plus 1.
Modify your existing TI processes to include this code in the Prolog and Epilog.
PROLOG:
vThisProcess = GetProcessName() ; # Get the current count of rows in the cube for this process, then increment by 1 to get the next empty rowvRow = CellGetN( 'TI Tracker', vThisProcess, 'All Lines', 'Counter') ;vNextRow = vRow + 1 ; vStartDate = TIMST( NOW, '\Y-\m-\d' );vStartTime = NOW ; CellPutS( vStartDate, 'TI Tracker', vThisProcess, NumberToString(vNextRow), 'Start Date' ) ;CellPutN( vStartTime, 'TI Tracker', vThisProcess, NumberToString(vNextRow), 'Start Time' ) ;METADATA / DATA TABS:
# Do your normal processing on these tabsEPILOG:
vEndDate = TIMST( NOW, '\Y-\m-\d' );vEndTime = NOW; CellPutS( vEndDate, 'TI Tracker', vThisProcess, NumberToString(vNextRow), 'End Date' ) ;CellPutN( vEndTime, 'TI Tracker', vThisProcess, NumberToString(vNextRow), 'End Time' ) ;
After running the process with the updated code, your cube will be populated.

What happens when I run out of Line Numbers?
You can manually add elements to the dimension or create a larger dimension to start with. Another option would be to check the All Lines and Counter and compare it to the Dimension Size using the DIMSIZ function.
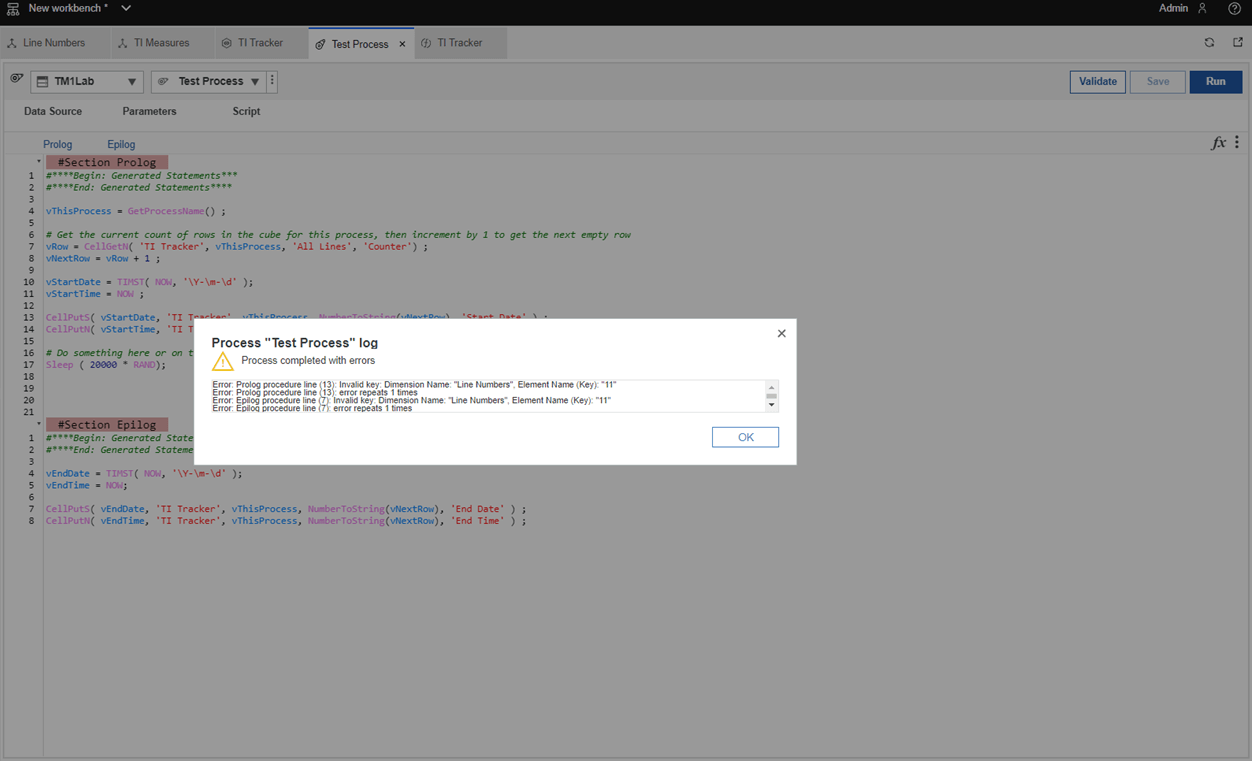
If you run out of line numbers, you will see a message like this. In this example, I reduced the line numbers to be from 1 – 10 and when it tried to populate line 11, it throws an error
You could have a monthly or annual process that adds more line numbers to the dimension. A more elegant solution would be to add a new row as it is needed. Add this code to the Process in the Prolog.
# Check to see if the next row number equals the size of the dimensionIF ( vNextRow = vDimSize ) ;DimensionElementInsertDirect ( vDim, '', vNextRowStr, 'N') ;DimensionElementComponentAdd ( vDim, 'All Lines', vNextRowStr, 1.0 ) ;ENDIF;
You can use the notes measure to write out messages from the process such as number of records processed, count of errors logged, etc. This would require additional logic and code that could be incorporated into the Process.
Next Steps
We hope you found this article informative. Be sure to subscribe to our newsletter for data and analytics news, updates, and insights delivered directly to your inbox.
If you have any questions or would like PMsquare to provide guidance and support for your analytics solution, contact us today.